 View All
Mapping all the frogs in Australia


Australia is home to over 240 frog species, most of them endemic. Some are thriving, but many are threatened by habitat loss, pollution and more. 4 species have already become extinct. We need to know more about the distribution, habits and changing populations of Australia’s frogs - so the Australian Museum came up with an ambitious citizen science plan.
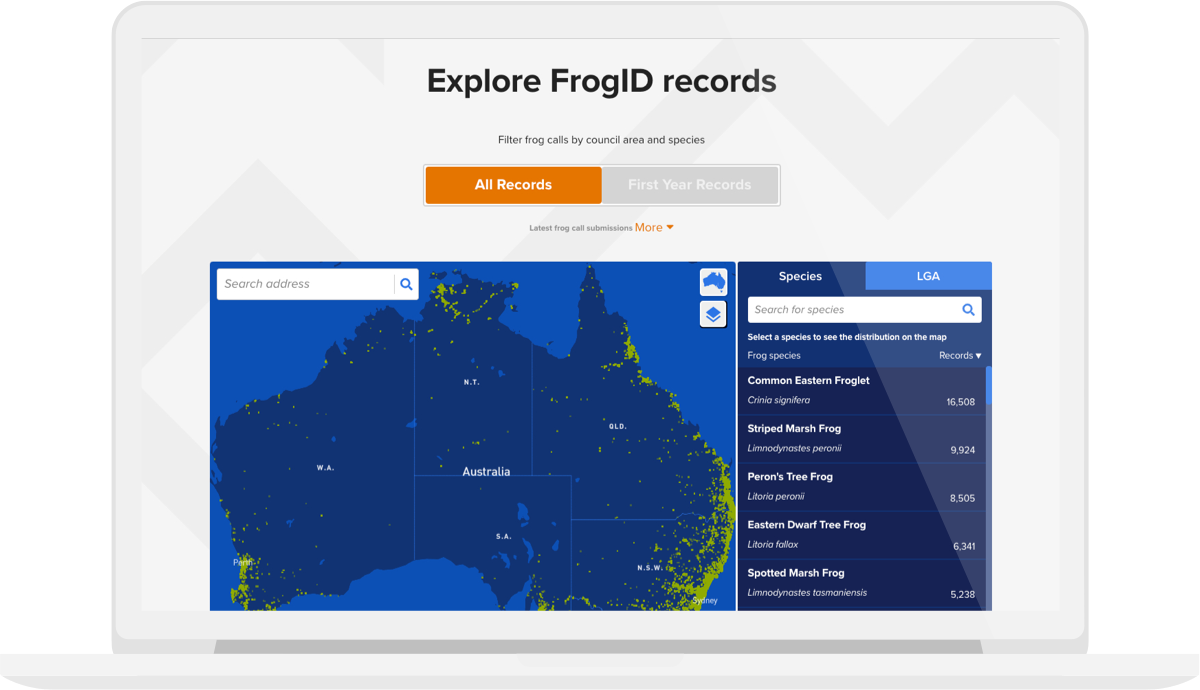
In 2017 we helped the Australian Museum to design an app that allows anyone to record frog calls in their area, and send them back to the museum for verification. This year they sent us the recorded data from the app, and we created an interactive map to show the findings.
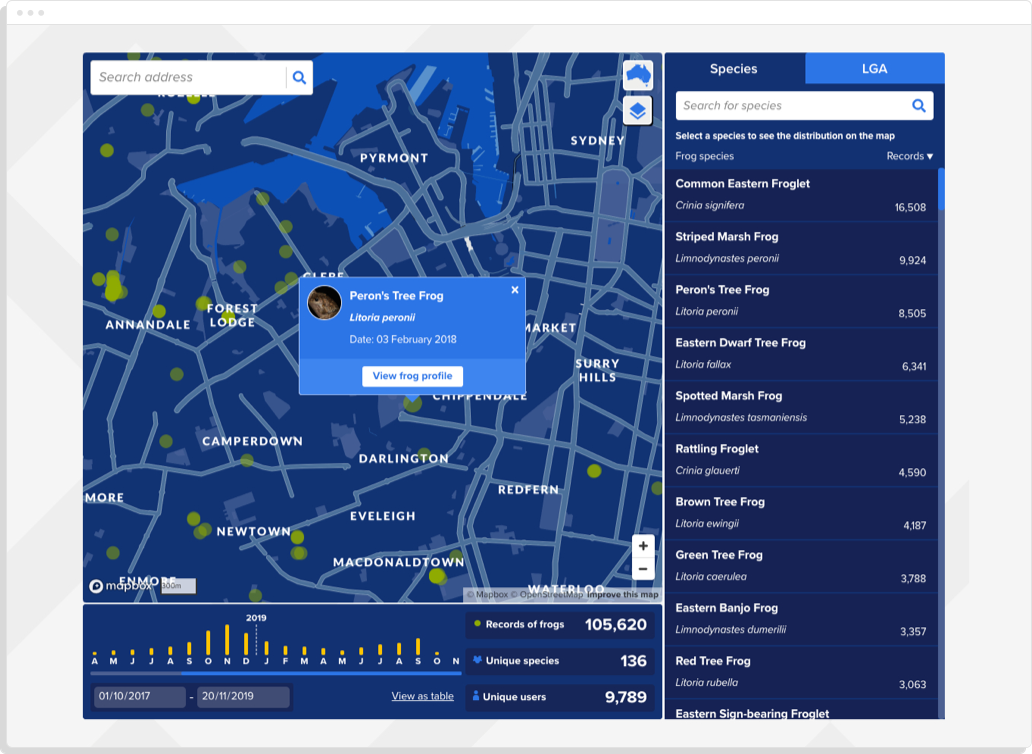
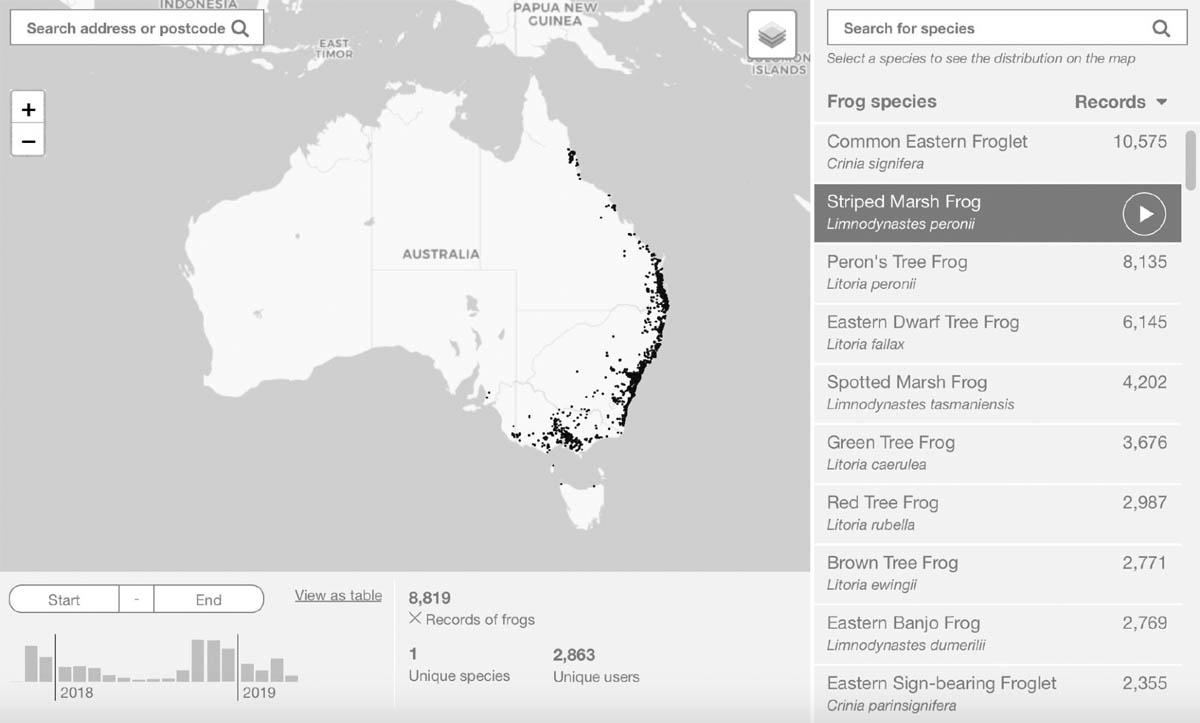
The final product, built using React with a Mapbox basemap, has many powerful filtering options. Visitors to the Australian Museum site can view frogs records by species, Local Government Area, address, and time of year, or any combination of these. A histogram in the lower left shows the number of frog calls recorded by month, for a given selection.
You can play frog calls, select different map themes, and popups bring up more information. These link to more detailed descriptions of the frogs on the Australian Museum site.
The map received over 12,000 page views in the first month, and the FrogId team won a Eureka prize for their work:
You can hear more about the FrogId project here:
Incidentally we built the first app mockups using our very own Sketch plugin Chippencharts (which is free for anyone to use), as well as Data Populator. Thanks to these tools, we were able to use the real data right from the start of the design phase:
Using real data for our designs helped us identify potential issues early in the process, for example when multiple frog records have the same location. (You can read more about our approach to data-driven mockups here).
Related projects and articles
-
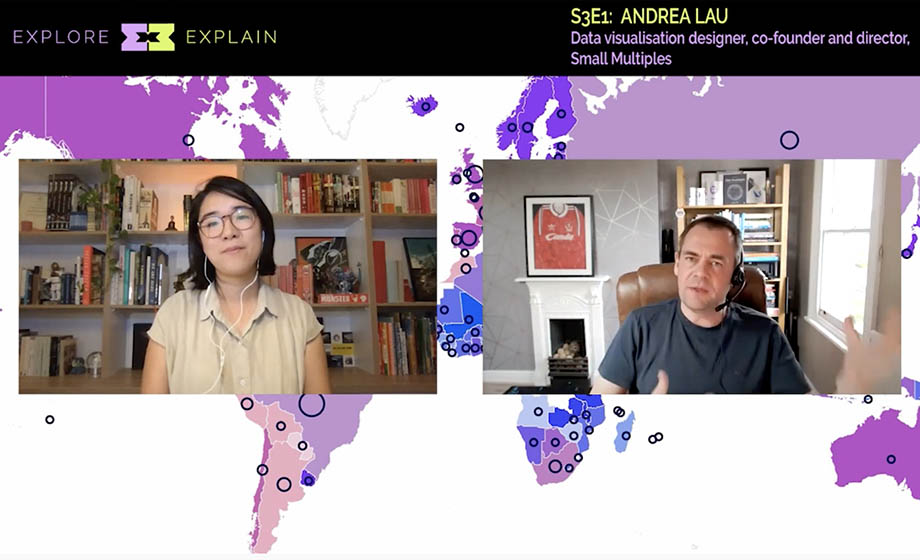
Andrea Lau in conversation with Andy Kirk: Explore Explain podcast
Article
-
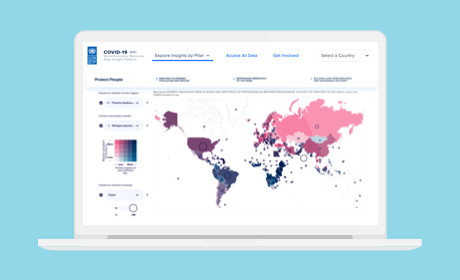
COVID-19 Socio-Economic Recovery Data Insight Platform
United Nations Development Programme
-
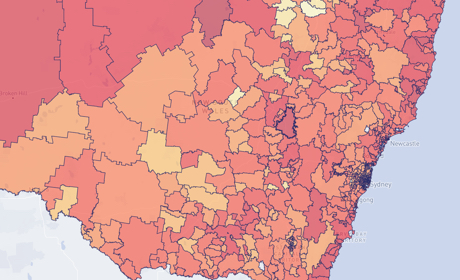
Occupational Risk due to COVID-19 in NSW
Article
-
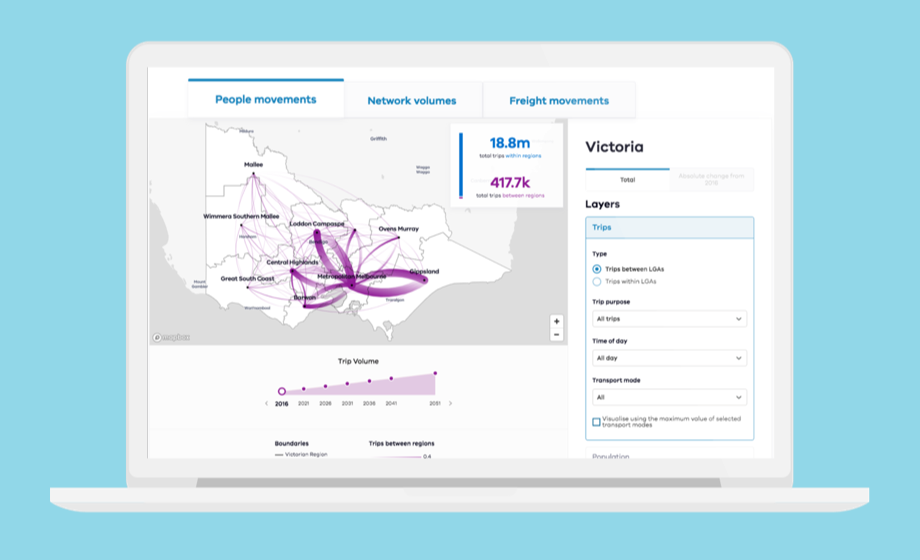
Visualising public transport and private vehicle trips around Victoria
Transport for Victoria