With the right knowledge, data becomes an empowering instrument for change. We offer data visualisation training that’s practical, inspiring and customised to meet your needs.
Data can look complicated from the outside. But it shouldn’t be. We’re passionate about making data visualisation accessible to everyone. That includes your data scientists, your communicators, your staff, your clients, your prospects and you.
2021 training programme
- Data Visualisation Training for Cancer Institute NSW, January 2021
- Data Visualisation Training for WA Department of Premier and Cabinet, February 2021
- Data Visualisation and BI Platforms for YFoundations April 2021
- Master of Business Analytics at Melbourne Business School, April - July 2021
- Master of Interaction Design and Electronic Arts Graduation Studio, Semester 1 2021
2020
- Master of Data Science and Innovation at University of Technology Sydney, March - June 2020
- Master of Business Analytics at Melbourne Business School, April - July 2020
Practical, Inspiring Data Visualisation Training
Our data visualisation training gives you the knowledge and tools you need to reimagine your data. Whether you want to impress your clients or your colleagues, our instructors will put the power in your hands. You’ll be surprised by how much you can learn in just a few hours.
What will you learn in our data visualisation course (aka key learning objectives)?
- a brief history of data visualisation (it’s been going on since 1626!)
- how and why data visualisation works (or, as it’s more fancily known, theories of perception)
- the fundamental rules of data visualisation, from colour palettes to ordering information
- the latest data visualisation applications and techniques, from augmented reality to interactive maps
- how to simplify your data for maximum impact
- how to work out the question you want to answer
- how to determine your target users and command their attention
- how to build a data ETL pipeline (that’s extract, transform, load)
- where and how to find ideas and inspiration
What can you expect?
Every data visualisation training course involves both expert instruction and interactive experiences. Our trainers will give you stacks of tools, rules, techniques and inspiration, before daring you to jump right in – and come up with a data visualisation of your own. Along the way, you’ll be invited to share ideas and ask questions.
Your place or ours?
Our data visualisation courses are flexible and fully customisable. We’re available for one-off data visualisation workshops, multi-day data visualisation courses and everything in between.
And we can teach anywhere and everywhere – from special events at your premises to conferences on the other side of the country.
Meet Our Expert Data Visualisation Instructor
ANDREA LAU
Andrea has been a passionate educator and advocate for data and visual literacy since 2006, when she embarked on her teaching journey as a researcher at the University of Sydney.
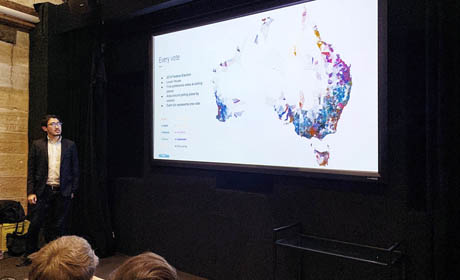
Since then, she’s co-presented a series of full-day workshops at Guardian Australia in Sydney and Melbourne alongside data journalist Nick Evershed, taught evening workshops at General Assembly and lectured final year students in the Bachelor of Design (Computing) at the University of Sydney.
Every year, she presents at conferences in Sydney, Melbourne and Canberra, as both a keynote speaker and panel member.
Andrea has taught at ASX 100 companies, universities and government agencies across Australia. These include Commonwealth Bank, Australian Securities and Investment Commission (ASIC), The Guardian, General Assembly, University of Sydney, Monash University and University of Technology, Sydney.
Visit Andrea on LinkedIn and find out what she teaches at General Assembly.
“I thoroughly enjoyed Andrea’s presentation. Her enthusiasm was wonderful! I took away some great practical tips that I will be able to apply in my role. It was also incredible to see all the different examples presented. It really shows just how endless the options are when it comes to data visualisation. I don’t consider myself a very creative person, so having these tools and inspiration at my fingertips is fantastic. I’ve already gone back over the presentation several times. I really appreciate being given the opportunity.
– Full-day workshop participant, Queensland Department of Education, June 2018
Ready to learn more about data visualisation training and data visualisation courses?