 View All
Visualising public transport and private vehicle trips around Victoria


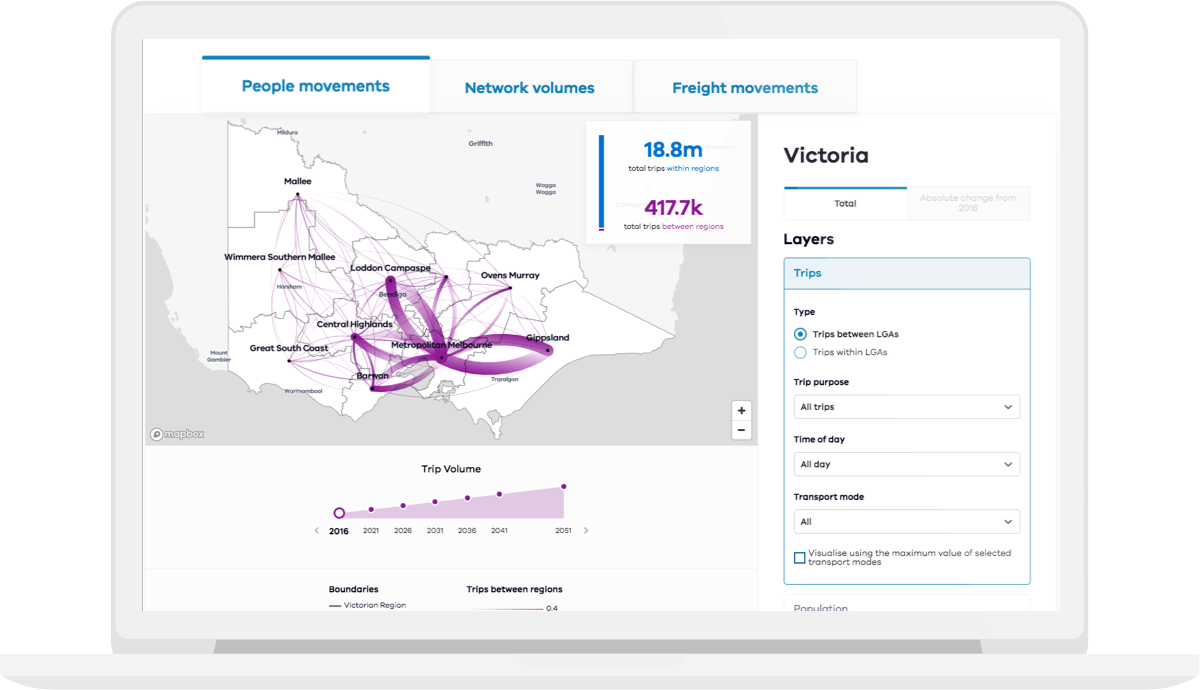
We have been working closely with Transport for Victoria over the past year to create an internal data visualisation portal, helping them to track progress against their strategy and to plan and foresee future growth on all transport networks.
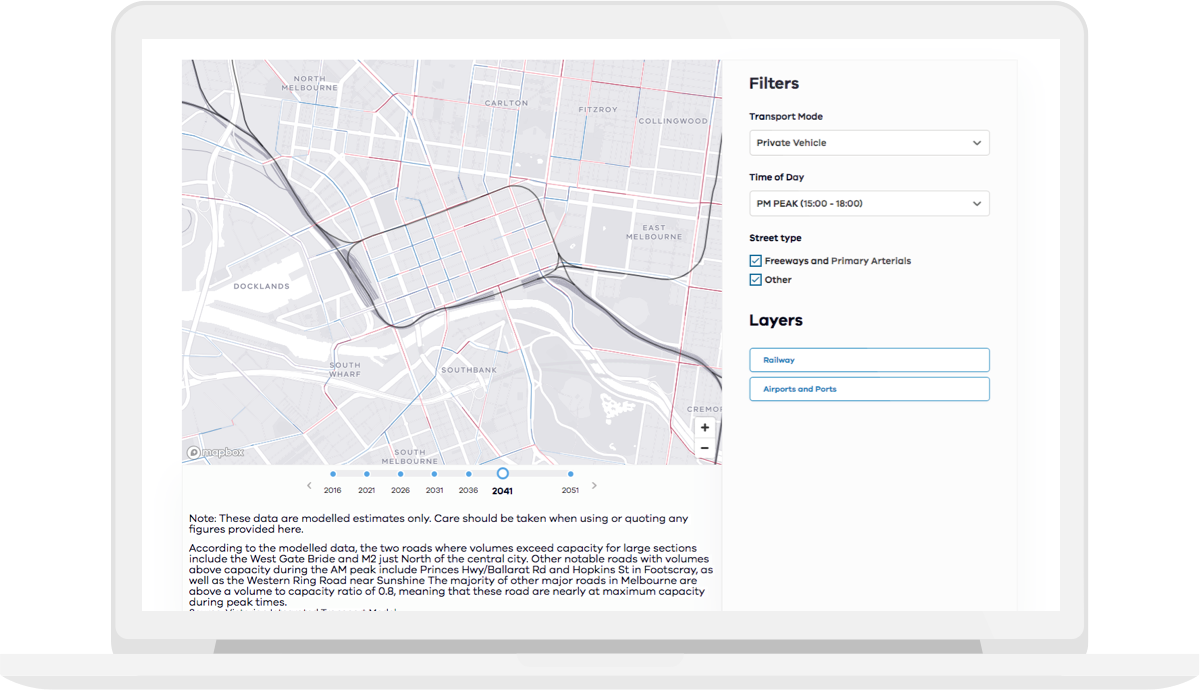
The maps are custom-designed and high-performance with intuitive interaction and filters supported by dynamic data which can be updated over time.
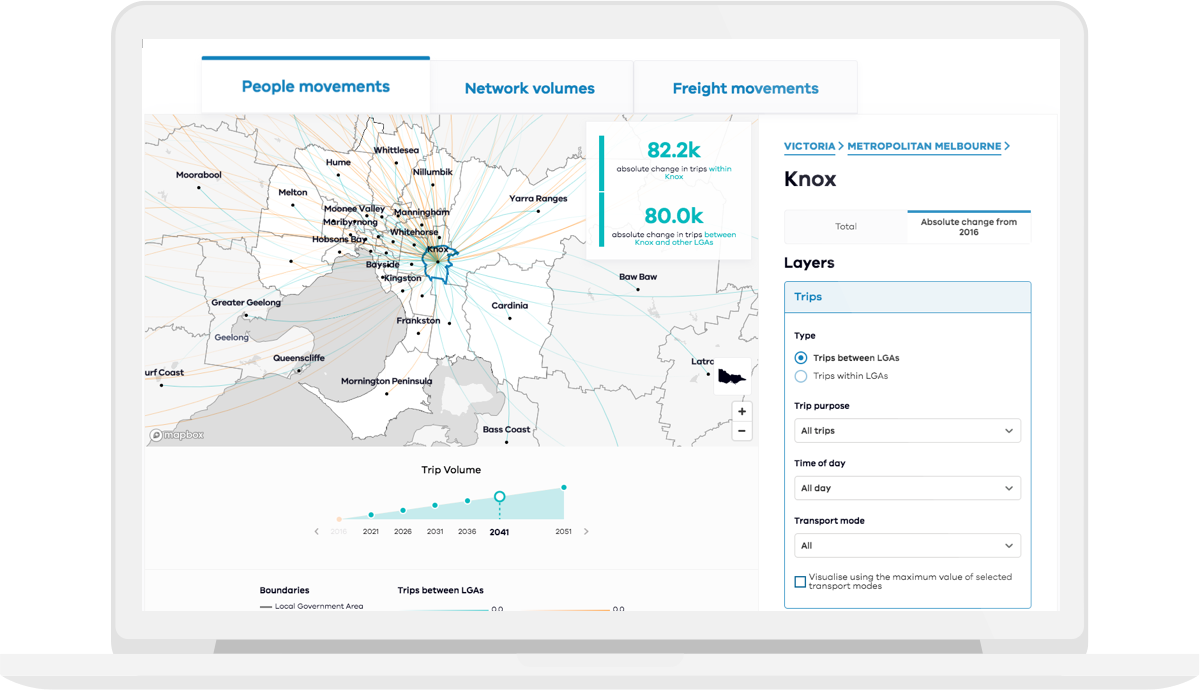
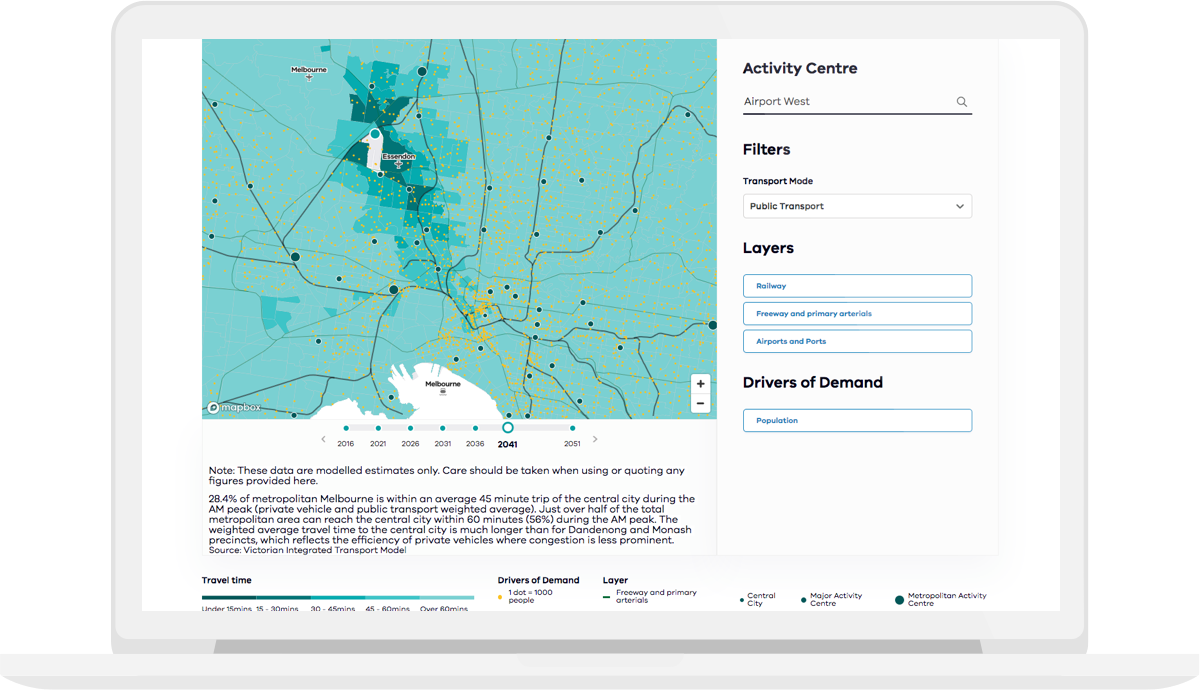
People can interrogate data at the state, region, LGA, and activity centre level. Multiple filters allow the user to configure and view data that is most relevant to them and then download the filtered data via CSV.
The platform allows administrators to login and edit content on pages and update datasets.
Related projects and articles
-
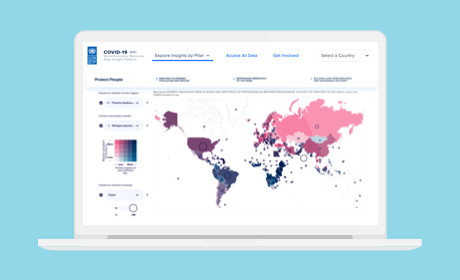
COVID-19 Socio-Economic Recovery Data Insight Platform
United Nations Development Programme
-
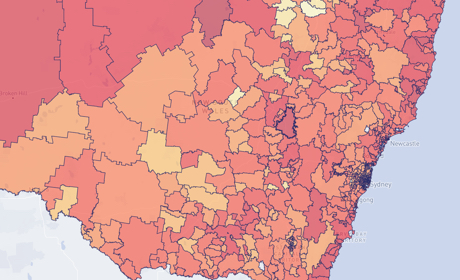
Occupational Risk due to COVID-19 in NSW
Article
-
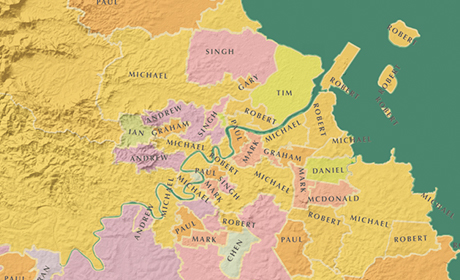
Business empires in Australia
Article
-
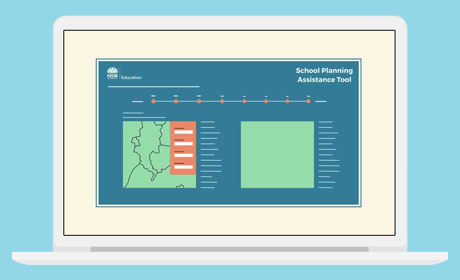
School Planning Assistance Tool
NSW Department of Education