Data visualisation provides solutions to some of the biggest problems facing businesses. By replacing speculation with hard data, you can take your company where you want to go – and your clients and colleagues along for the ride.
Want to show your team that processes could be quicker, cheaper and more effective? Got an idea for a product, but no time to put it on paper? Wish your marketing campaigns would perform better, but not sure where to spend your money? Wondering if your proprietary data could generate more value?
Whether you’re a big player or small business, we can up your game with data visualisations that answer tough questions, prove your brilliance and persuade your people. So far, we’ve tracked social impact for Westpac, created a customers insights dashboard for Telstra and automated due diligence processes for Urbis, among many other projects.
How can we make your data work harder for you?
Data visualisation and product development
Energy consumption dashboard for office buildings (Buildings Alive)
The development of products and services is key to the success of every business. But, here’s the catch. Product development involves extensive research, design and prototyping. And that means big dollars. You might think you have the best idea in the world, but persuading people to put money behind it isn’t easy. After all, there’s a lot of parties fighting for the pie.
What you need is proof. Irrefutable proof. And a cheaper, faster way to get to minimum viable product (MVP).
Data visualisation can help with both. Whatever the facts and figures that support your product, we can turn them into a persuasive case that’s impossible to ignore. Are you looking for:
- a compelling pitch that proves the need for your product?
- an interactive map that showcases your target market: geographically, demographically and/or economically?
- an online tool that conducts market research?
- a unique web application no one else has thought of yet?
Once you’ve crunched the numbers and attained initial approvals, it’ll be time to move forward with prototyping and testing – as soon as possible.
You can put this in our hands, too. Working closely with you, we’ll come up with a variety of prototypes and testing strategies at lightning speed. Forget about waiting endlessly for your busy, in-house team to get moving.
Our multi-disciplinary team of data specialists, UI/UX experts, designers, developers and project managers will delve deep into your users’ minds – through thorough, data-driven research. Then, to maximise potential engagement with your product, we’ll devise a range of user journeys.
Unlike so many in-house teams, we’re fast-moving, energetic and full of fresh ideas. Plus, we share decades of experience between us, so we come armed with loads of tricks of the trade. Our goal is to optimise your ROI at every stage.
Data visualisation, dashboards and reporting
One of the biggest enemies to productivity is inefficiency. But, without an objective method for pin-pointing inefficiencies, continuous improvement is difficult – if not impossible.
This is where data visualisation can work wonders. Rather than going down rabbit holes, you need facts on which you can rely. Facts based on logical, unbiased research. That way, rather than convincing colleagues to see things your way, you can win them over through demonstration. After all, showing is more powerful than telling.
If you want to:
- work better
- hire smarter
- find customers more quickly
- find customers who are more committed, loyal and active
- explore new markets
- save money, time and energy …
There’s a data visualisation that can get you there. And our talented team can deliver a customised solution that supports your unique goals.
Data visualisation and marketing
Tracking sustainability through data (Westpac)
Is your image lagging behind your current practices? Do you need to impress investors and shareholders? Are you ready to expand to new markets – either in your home country or on the other side of the world?
Data visualisation can transform the way people see your business, products and services. If you’re on a mission to:
- demonstrate outstanding value to shareholders
- create inspiring reports (including your annual report)
- boost your presence in a particular market
- build your credibility or expertise in a particular area
- showcase your business’s performance in a national or global context …
You can. After all, what’s more persuasive than facts and figures – especially when those facts and figures tell engaging stories and answer meaningful questions? The way that people perceive your business – from employees to prospects – is central to your ability to expand, diversify and serve your shareholders.
Meet our multidisciplinary, flexible, fast-working team
Success in business often depends on speed. But, in reality, securing support for product development and revolutionary marketing campaigns can take time. Often, the bigger your company, the more hoops there are to jump through.
We’re here to help you save time, money and energy. As an efficient, full-service, end-to-end agency, we bring our expert multidisciplinary team to every job. Our agile, experienced data experts, UX/UI specialists, designers, developers and project managers are all based in our Sydney office.
To ask questions, book a meeting or launch a project, please …
Related projects and articles
-
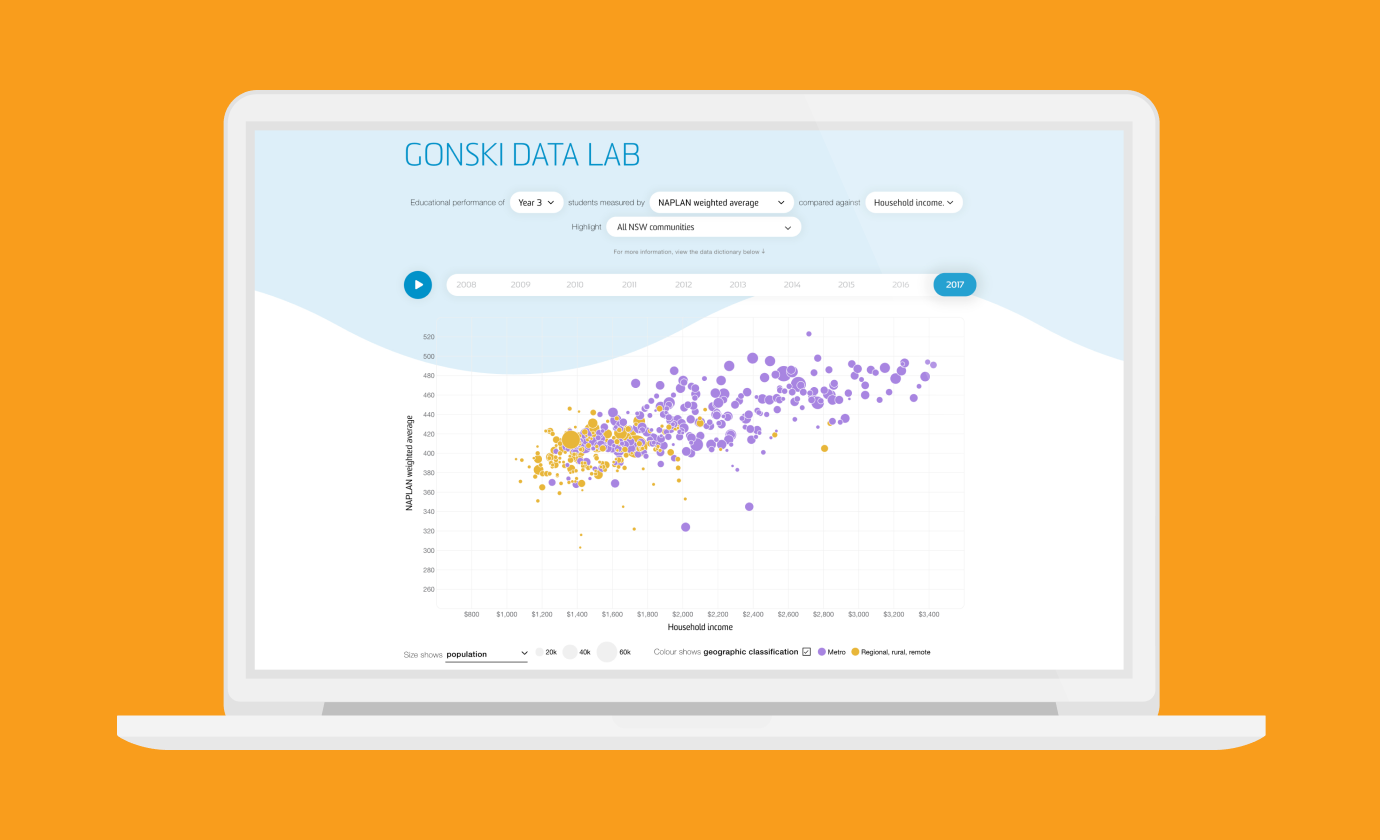
Revealing the social factors behind school performance
Gonski Institute for Education
-
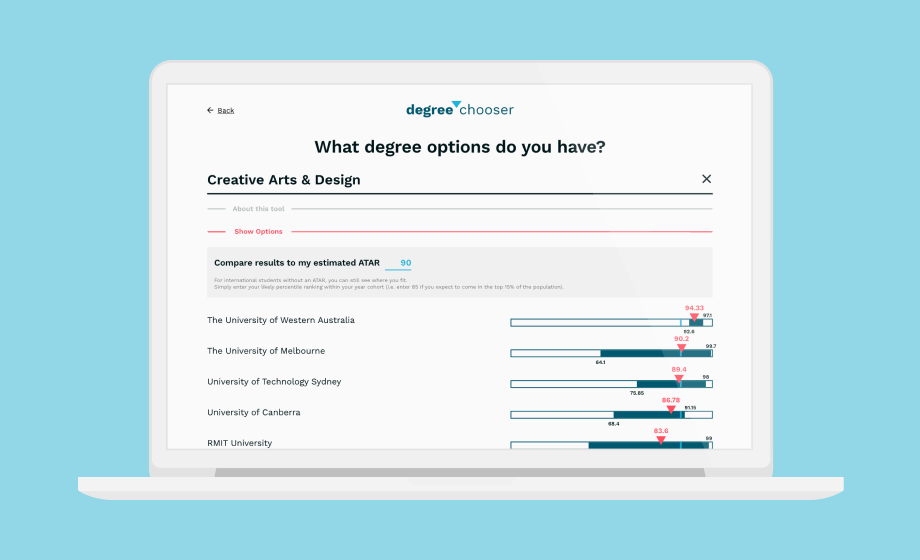
Degree Chooser
Barlow Advisory