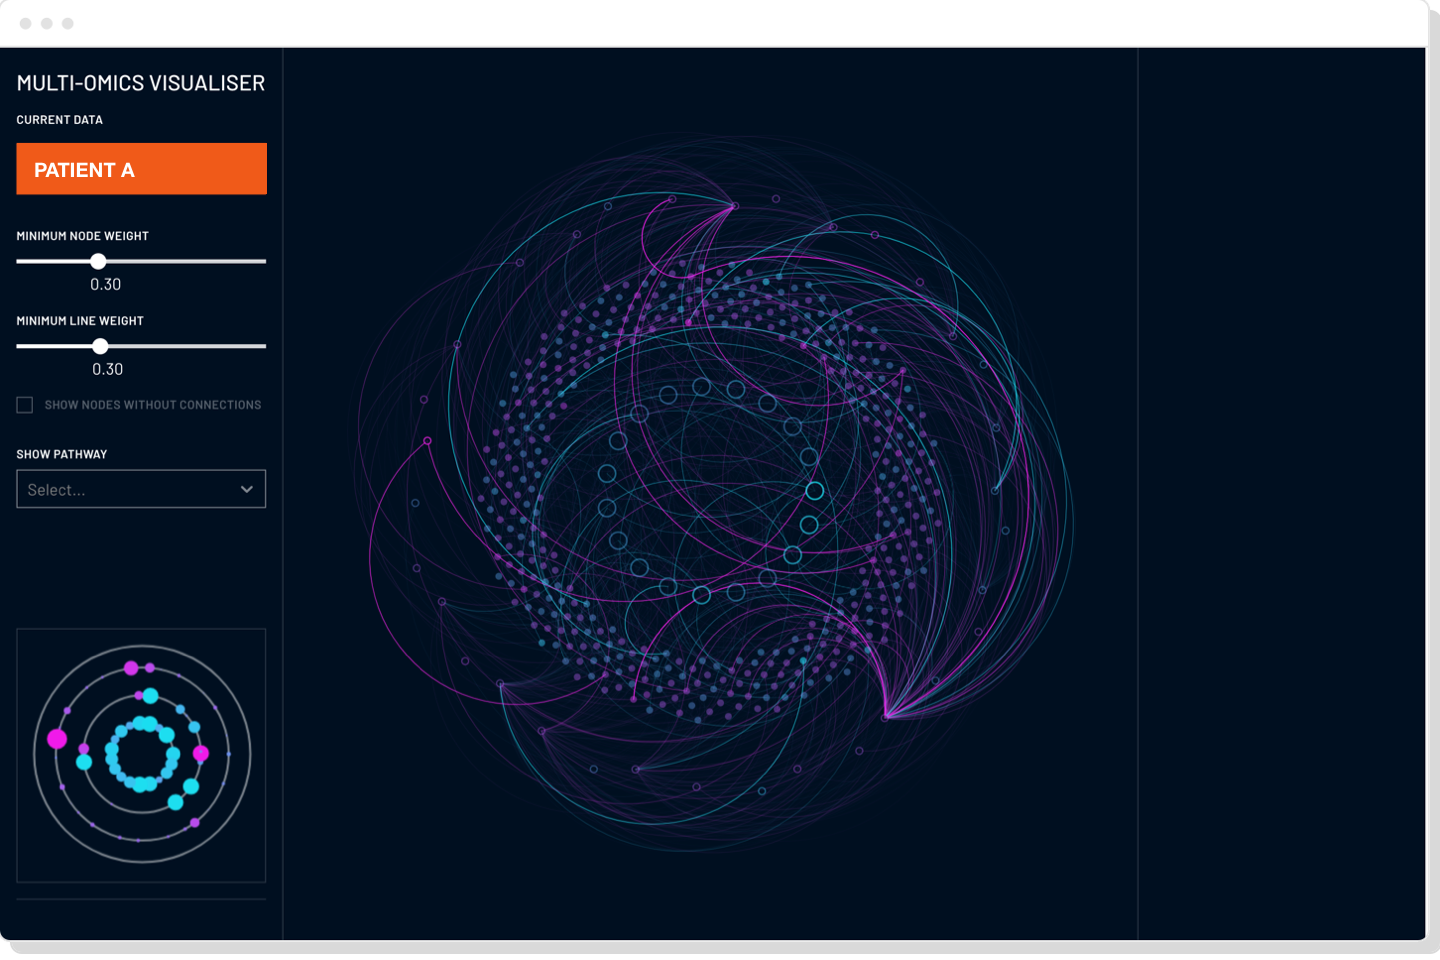
We work with research institutes, scientific bodies, universities and government organisations to help display their findings to the world.
You’re confident that your research could cure disease, improve public health, protect the environment or save the world. But sometimes even the best research needs visual help to communicate its message.
That’s where data visualisation can help. You’ve worked for a long time to create complex calculations, tables of data and detailed explanations - now it’s time to transform your research project into a narrative that anyone can understand – and everyone will recognise as vital. We’ve found that data visualisation can even help researchers see patterns that were hidden in a matrix of figures.
Or perhaps you’re still in the process of securing funding - we can help you create a clear, compelling, visual story that will get people to listen.
We’ve worked with a variety of research institutes, scientific bodies, universities and government organisations. We’ve created:
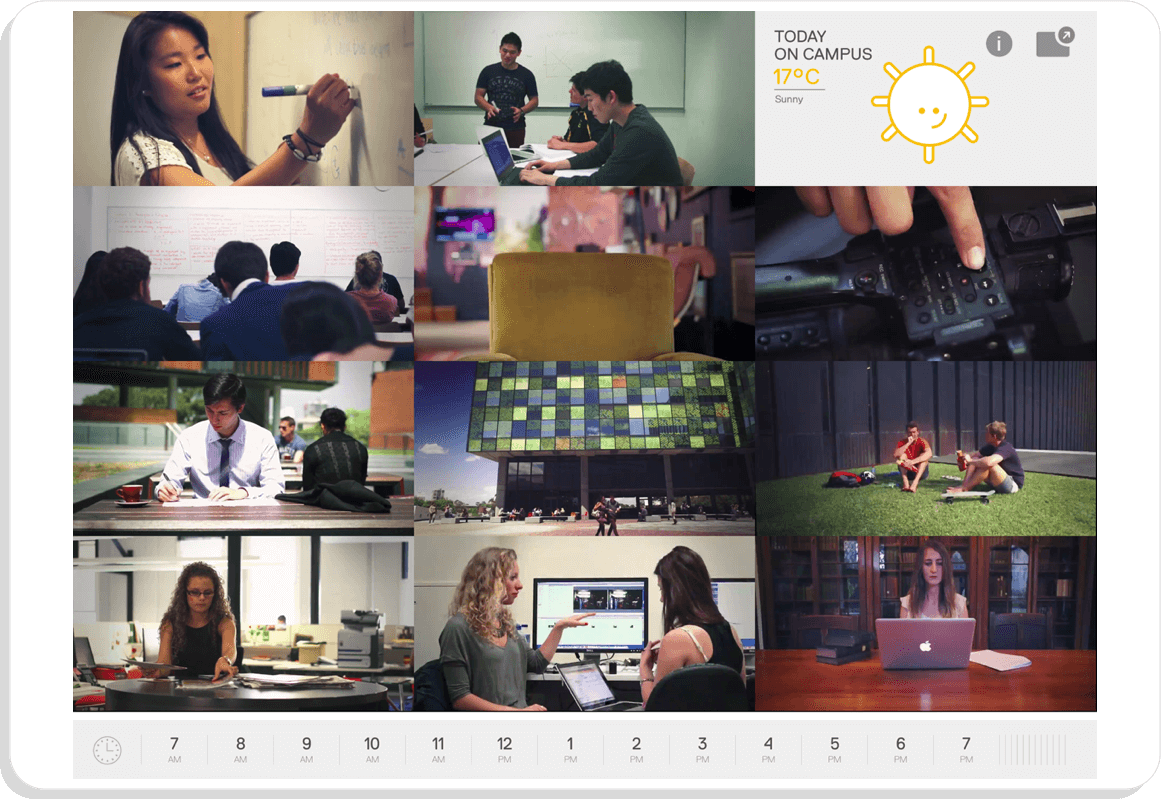
- A fully responsive website that enables students to become citizen scientists, by measuring air quality around their schools (UNSW Climate Change Research Centre)
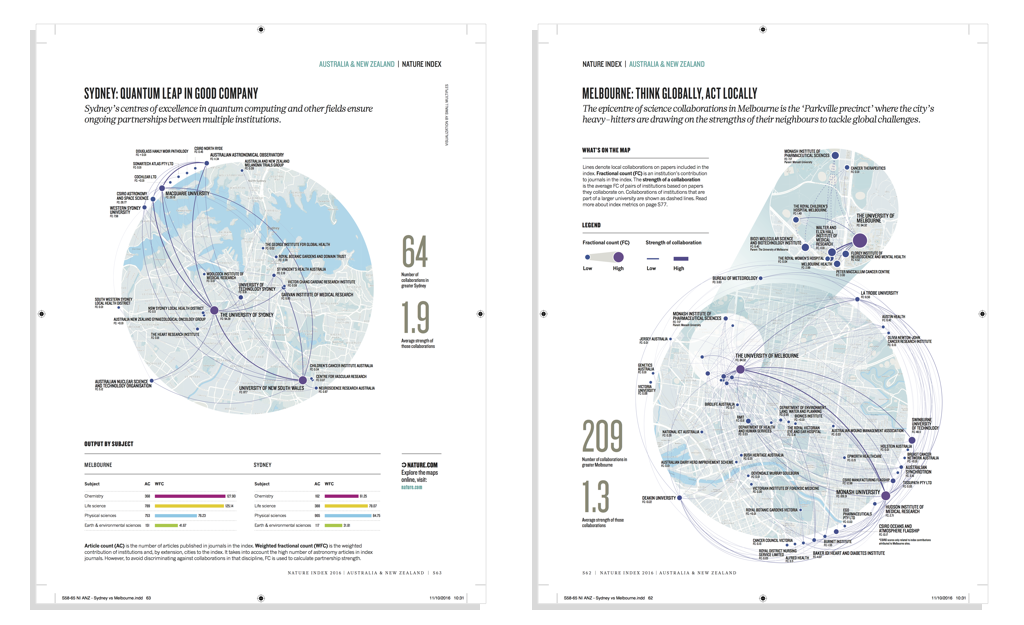
- An interactive map that explores relationships between research institutes (Nature Index Journal)
- An online tool that compares and contrasts public health research across both countries and income groups (World Health Organisation)
And these are just the start. We work regularly with researchers because we believe data has a powerful role to play in making the world a better, fairer and healthier place.
Obtaining funding through data visualisation
It’s no secret that science communication is an art. That’s why great science communicators are in such high demand. After all, while researchers are famous for their work ethic, accuracy and revolutionary ideas, interpreting the complications of the lab for the layperson is difficult.
Data visualisation is one way of making the process much, much easier. With an intelligently-designed data visualisation, you can:
- Communicate succinctly the problem your research will solve
- Demonstrate a proven need for your project
- Transform facts and figures into meaningful narratives
- Invite users to interact with your ideas
- Meet the criteria demanded by funding bodies
Essentially, data visualisation puts everything you need into a simple, straight-forward picture – or, if necessary, multiple pictures.
And you can decide what kind of data visualisation is best for you, be it an infographic, interactive map, online portal or one-of-a-kind application. If you’re unsure, our expert team is here to help.
Promoting your research through data visualisation
Have you completed a research project, but feel it could make a bigger impact? Are you struggling to get the media to take notice? Do you wish you could share your discovery with more people?
Data visualisation can help you command more attention – and ensure your project packs the punch it should. After all, you’ve put in the hard work, so why not tell the world?
Through data visualisation, you can:
- Communicate your findings clearly
- Make your research accessible to the general public
- Inspire the interest of the media
- Encourage users to explore and interact
- Collaborate with other researchers
- Transform your research into powerful software, from online tools to smartphone apps
Meet our thorough, innovative team
There’s a good reason why so many research institutes and scientific bodies have trusted us over the years. In fact, there are lots of reasons.
When it comes to transforming research into data visualisations, we’re thorough, meticulous and detail-oriented. We go to pains to make sure that all research in our hands is represented clearly, concisely and accurately.
In addition, we’re an end-to-end data visualisation agency. That means we can look after every aspect of your project, from formulating concepts, to prototyping, to development and delivery. Plus, if you or your colleagues need data visualisation training, our experienced instructors are on-hand.
Our multi-disciplinary team of data experts, UX/UI specialists, designers and project managers is based entirely in our Sydney office. This gives us the capacity to work with speed and flexibility. Whether you need an array of ideas to share with your team or a complete data visualisation turned around at lightning speed, we can deliver it.
We have worked with:
- The University of Sydney
- University of New South Wales
- University of Technology Sydney
- Australian National University
- Monash University
To find out more, book a meeting or get started …


