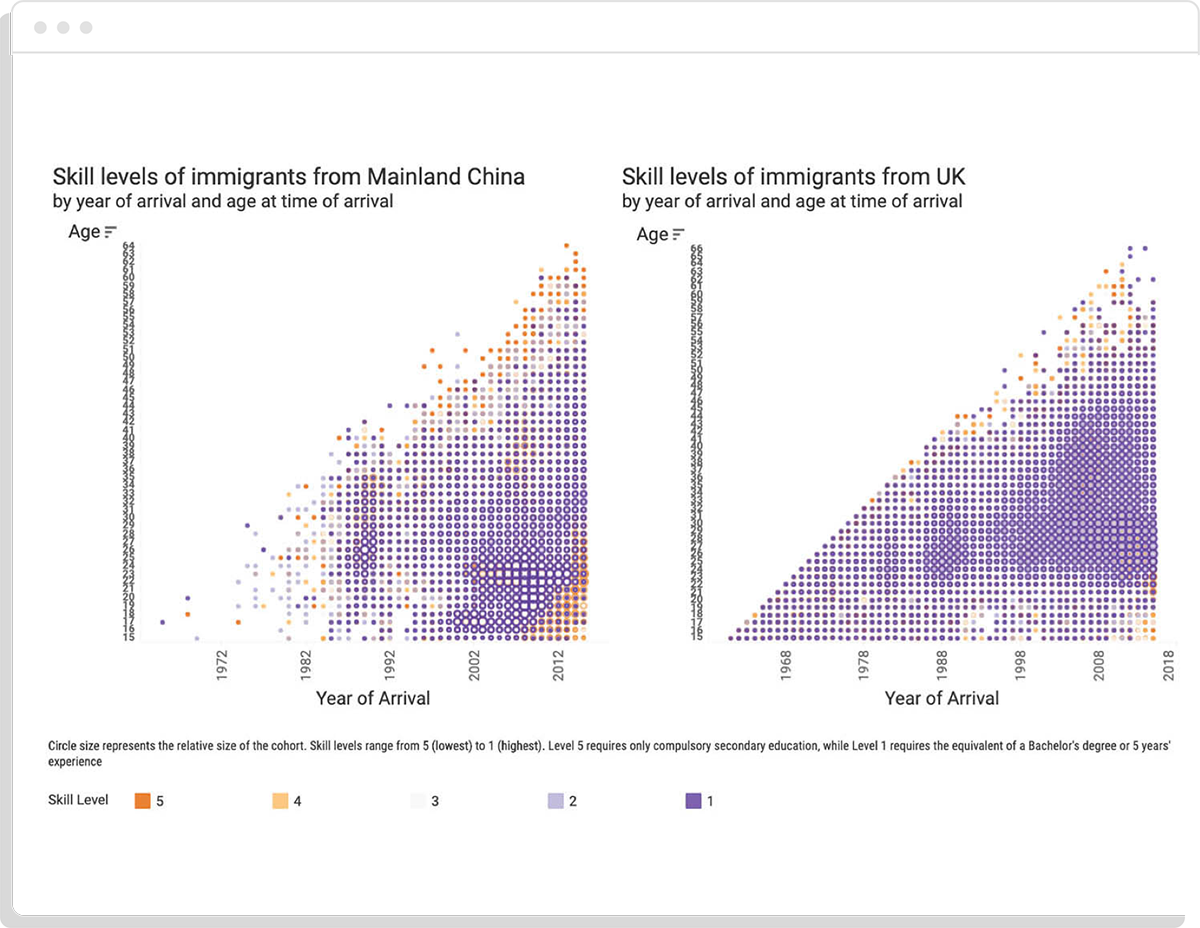
Get data insights fast. Combine powerful data visualisation tools like Tableau or PowerBI with Small Multiples’ expertise to understand your projects and business like never before.
Whether you need a basic set of charts, a report, dashboard or a map, there might be an off-the-shelf solution that can solve your problem. Without the need to code from scratch, you can get information from your data faster.
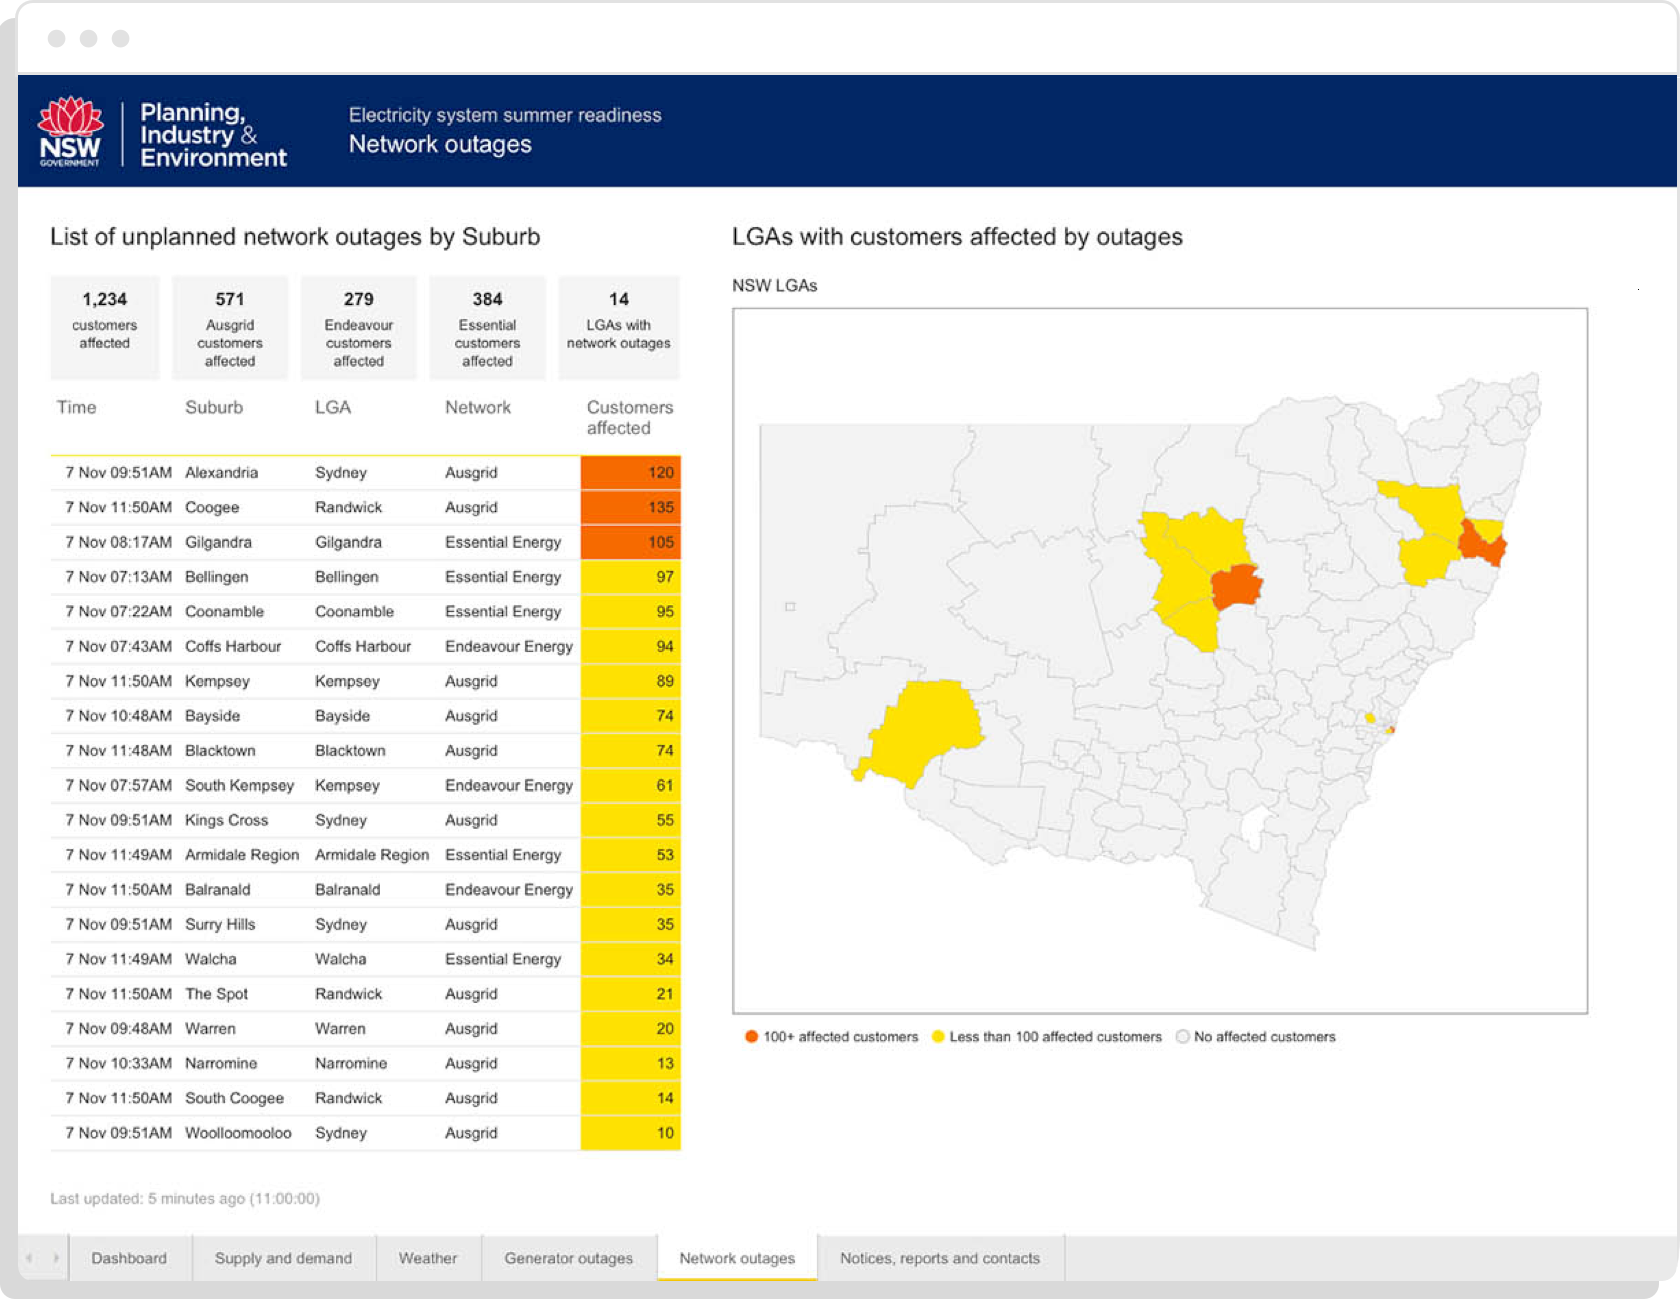
These tools are known as Software as a Service (SaaS), because they provide their ‘services’ on a subscription basis, rather than as classic shrink-wrapped software. SaaS tools for visualisation and Business Intelligence (BI) make the process of understanding data simpler, but there’s still some work involved:
- Deciding which metrics to focus on, and which chart types to use
- Getting your data in the right format
- Blending and joining different data sources
- Learning the tool
- Connecting your data
- Layout and design (essential for communicating your message)
- Potentially getting a software license.
That’s where an implementation partner like Small Multiples can help. If you’re not ready to hire an internal team to do these things, we have all the design, development and advising capabilities ready to go, to get you started quickly. We can find the most suitable solution for you based on your business requirements, and help you scale up or down as needed.
We can also organise training for your team. We’re Sydney-based, but we’ve also provided training interstate.
Here’s some of the tools we can use to help you realise your projects:
Infogram
Great for:
✔️ Public engagement
✔️ Simple charts and dashboards
✔️ Embedded charts
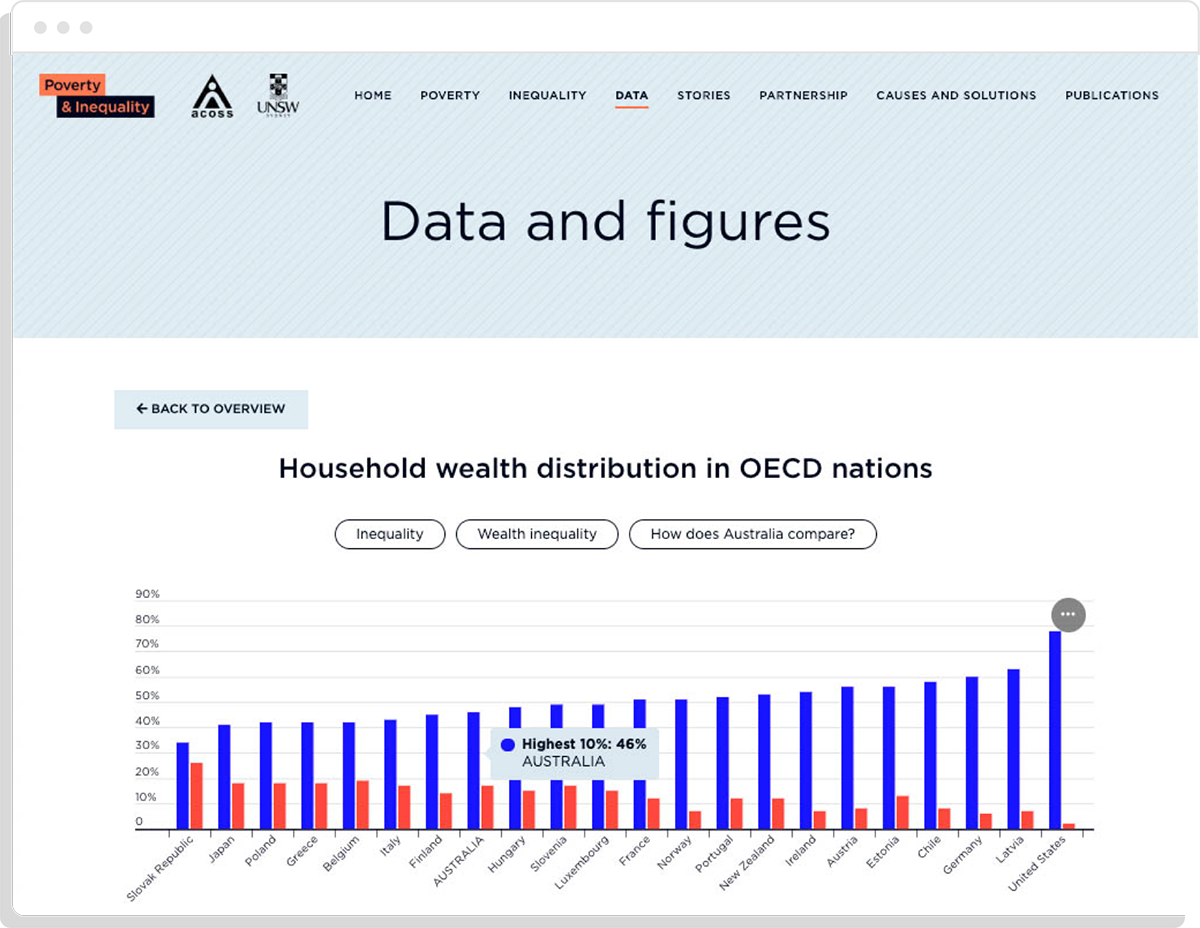
If you need simple, beautiful charts quickly, with your own branding applied, Infogram is the way to go. You can then easily download the charts or embed them in your web pages. We’ve used Infogram for a number of projects.
For the Australian Council of Social Services (ACOSS), we built a data hub that houses a wealth of research data on the causes of poverty and inequality in Australia. The site has over 100 Infogram charts embedded. The best part? Our client can easily update the charts from the Infogram website, without ever having to ask us to update your site.
Tableau
Great for:
✔️ Embedded charts
✔️ Wide range of chart types
✔️ Dashboards
✔️ Combining data sources
Tableau comes with a huge range of charts built in, and we use it regularly for embedding graphs in our own webpages. Tableau shines when it comes to combining data from multiple sources, and creating complex visualisations that others don’t support.
If you want some charts that really stand out, have a chat to us about creating some Tableau visualisations for you.
Google Data Studio
Great for:
☑️ Reports
☑️ Dashboards
☑️ Combining data sources
If you need to build a report or dashboard that’s shareable and easily updatable, Google Data studio is a great option. Your reports can have multiple pages, many charts, and pull data easily from Google Sheets, CSV, and many other places including databases.
We’ve built Data Studio reports for clients to visualise their company performance, survey results and more.
PowerBI
Great for:
✔️ Reports
✔️ Dashboards
✔️ Combining data sources
✔️ Business Intelligence
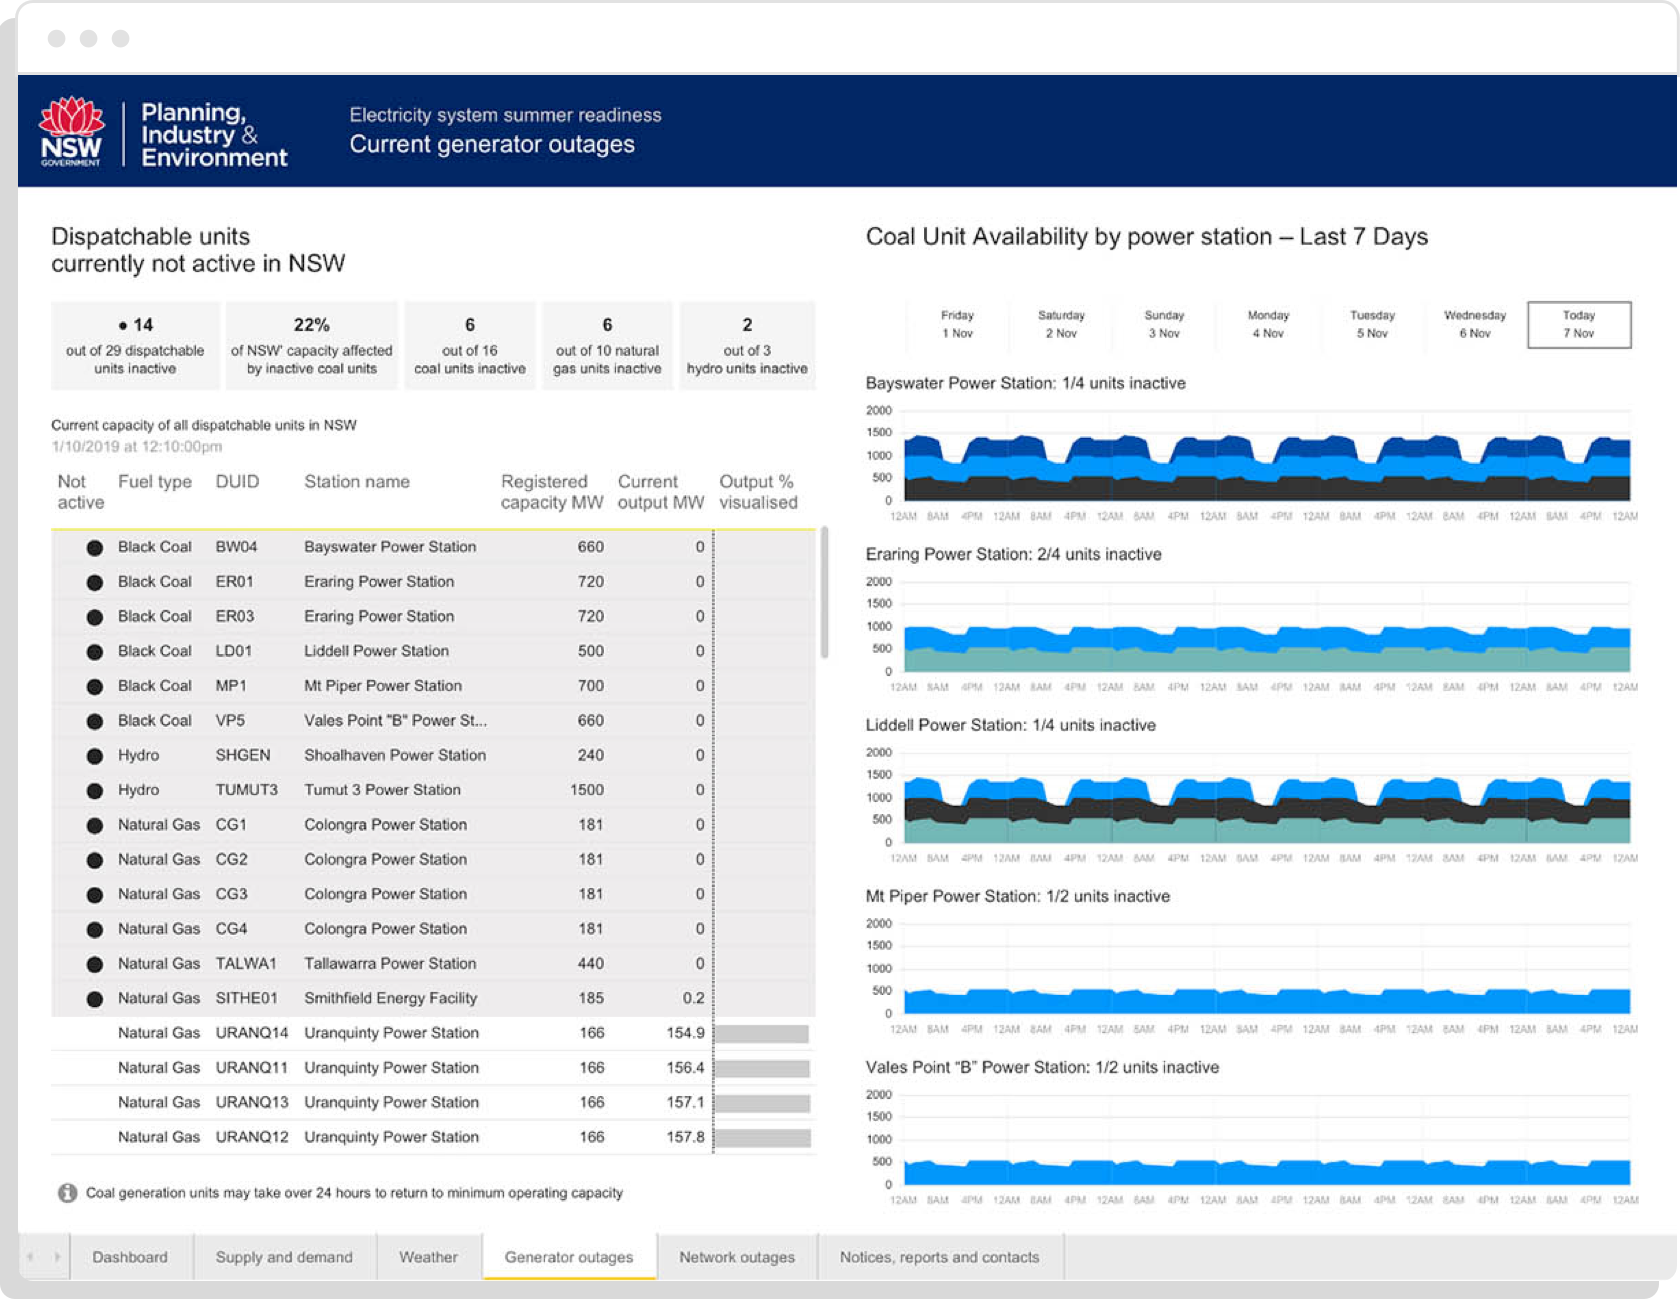
Microsoft PowerBI is an incredibly powerful tool when it comes to building dashboards and reports. It has a lot in common with Data Studio and Tableau, but will feel more familiar to those skilled in Excel and the Microsoft ecosystem.
We’re able to both design and build your PowerBI dashboards. We recently designed a dashboard for the NSW Department of Planning, Industry and Environment to track energy supply and demand across the state at peak times.
Carto
Great for:
✔️ Maps
✔️ Showing customers where you’re active
✔️ Combining maps with simple charts
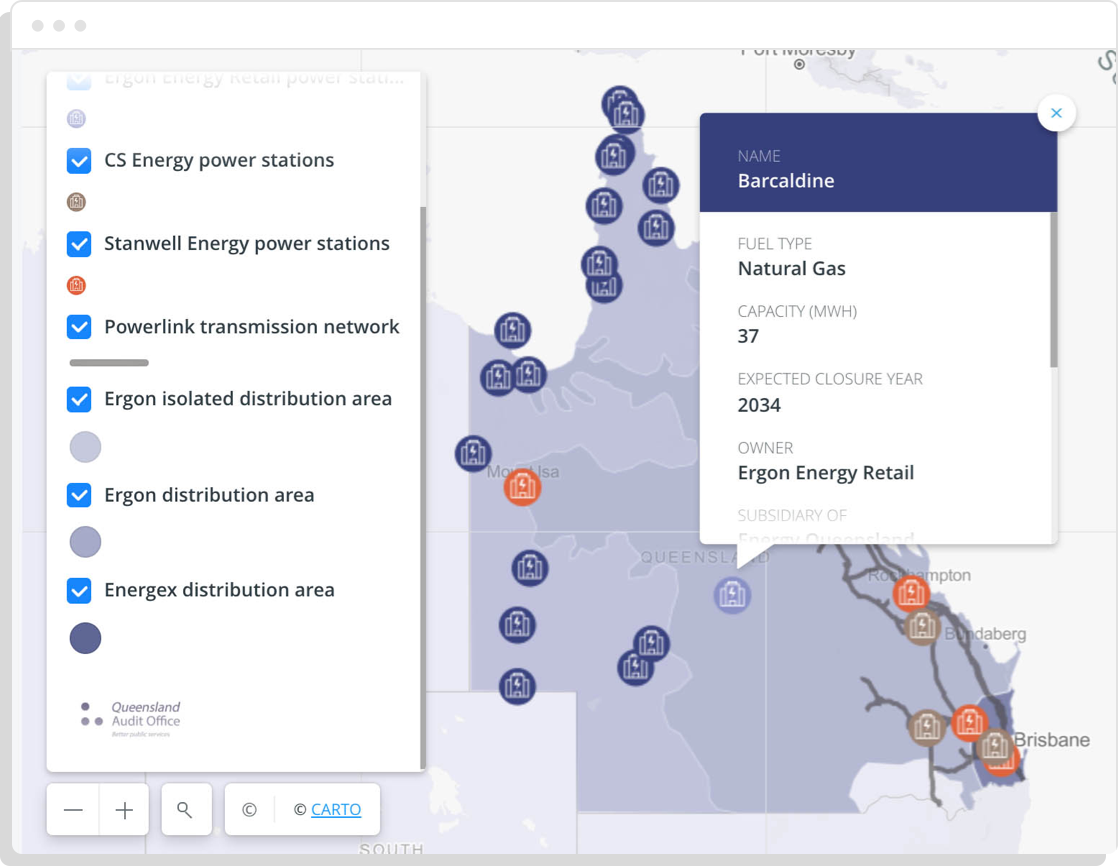
Carto allows you to build beautiful custom maps, easily. You can customise the look of your map, add your own icons, sidebars and popups, basic charts and more.
We’ve created Carto maps for several clients. One example is the Queensland Audit Office, who mapped the Queensland power grid on their website:
How could we transform your data into an insightful dashboard, report or set of charts?
If you’d like to ask a question, chat about an idea or book a consultation, please don’t hesitate to contact us.
