 View All
COVID-19 Socio-Economic Recovery Data Insight Platform
Data Visualisation Visual Design Web App Development Interactive Maps


The Challenge
The COVID-19 pandemic has affected nearly every aspect of life—from healthcare and transport, to employment and education. All over the world, governments have grappled with wave after wave of the virus, while finding ways to keep economies going.
Central to developing effective recovery solutions is accurate, reliable data, which provides insights into what works and what doesn’t—whether a government is determining the limits of a lockdown or executing a fiscal stimulus package. In Australia, there has been an intense focus on the impact of COVID-19 on unemployment, underemployment and Centrelink benefits, as well as on family and community services.
Globally, the key leader of the socio-economic response to the COVID-19 pandemic is the United Nations Development Programme (UNDP), which works alongside the World Health Organization (WHO) and the UN Office for the Coordination of Humanitarian Affairs. Every step of the way, the UNDP’s strategies have been informed by data gathered from various UN bodies, academic institutions, nonprofit organisations, development partners and nations.
However, given the diverse sources of this data, there have been significant variations in the ways in which it has been collected, collated, processed, analysed and stored. Consequently, it has been difficult and time-consuming for the UNDP to compare and contrast datasets—and to transfer easily the insights gained from one situation to another.
The Solution
To solve this challenge, the UNDP created the COVID-19 Socio-Economic Recovery Data Insight Platform and charged us with the task of creating data visualisation solutions.
The platform brings together a wealth of data on a single, user-friendly, online hub, in order to provide extraordinary insights into the impact of the COVID-19 pandemic and the journey towards socio-economic recovery around the world. This data comes from a variety of UN bodies and NGOs, from UNESCO, WHO and the International Labour Organisation (ILO) to the World Bank, Climate Watch and the Armed Conflict Location and Event Data Project (ACLED).
In transforming this information into a data visualisation, we needed to ensure that it would be clear and accessible to users of all levels of education, skills, experience and digital literacy. At the same time, we sought to illuminate a diverse array of connections, analyses and insights, across a variety of interactive tools.
Further, it was imperative that the data visualisation align with the five pillars of the UNDP’s framework upon which the platform is based. These pillars are: Health First, Protect People, Economic Recovery, Macro Response and Social Cohesion.
Given these broad and complex aims, we decided to adopt a multi-faceted strategy, which enables users to approach and filter the data according to their areas of interest.
COVID-19 and government policy: around the world
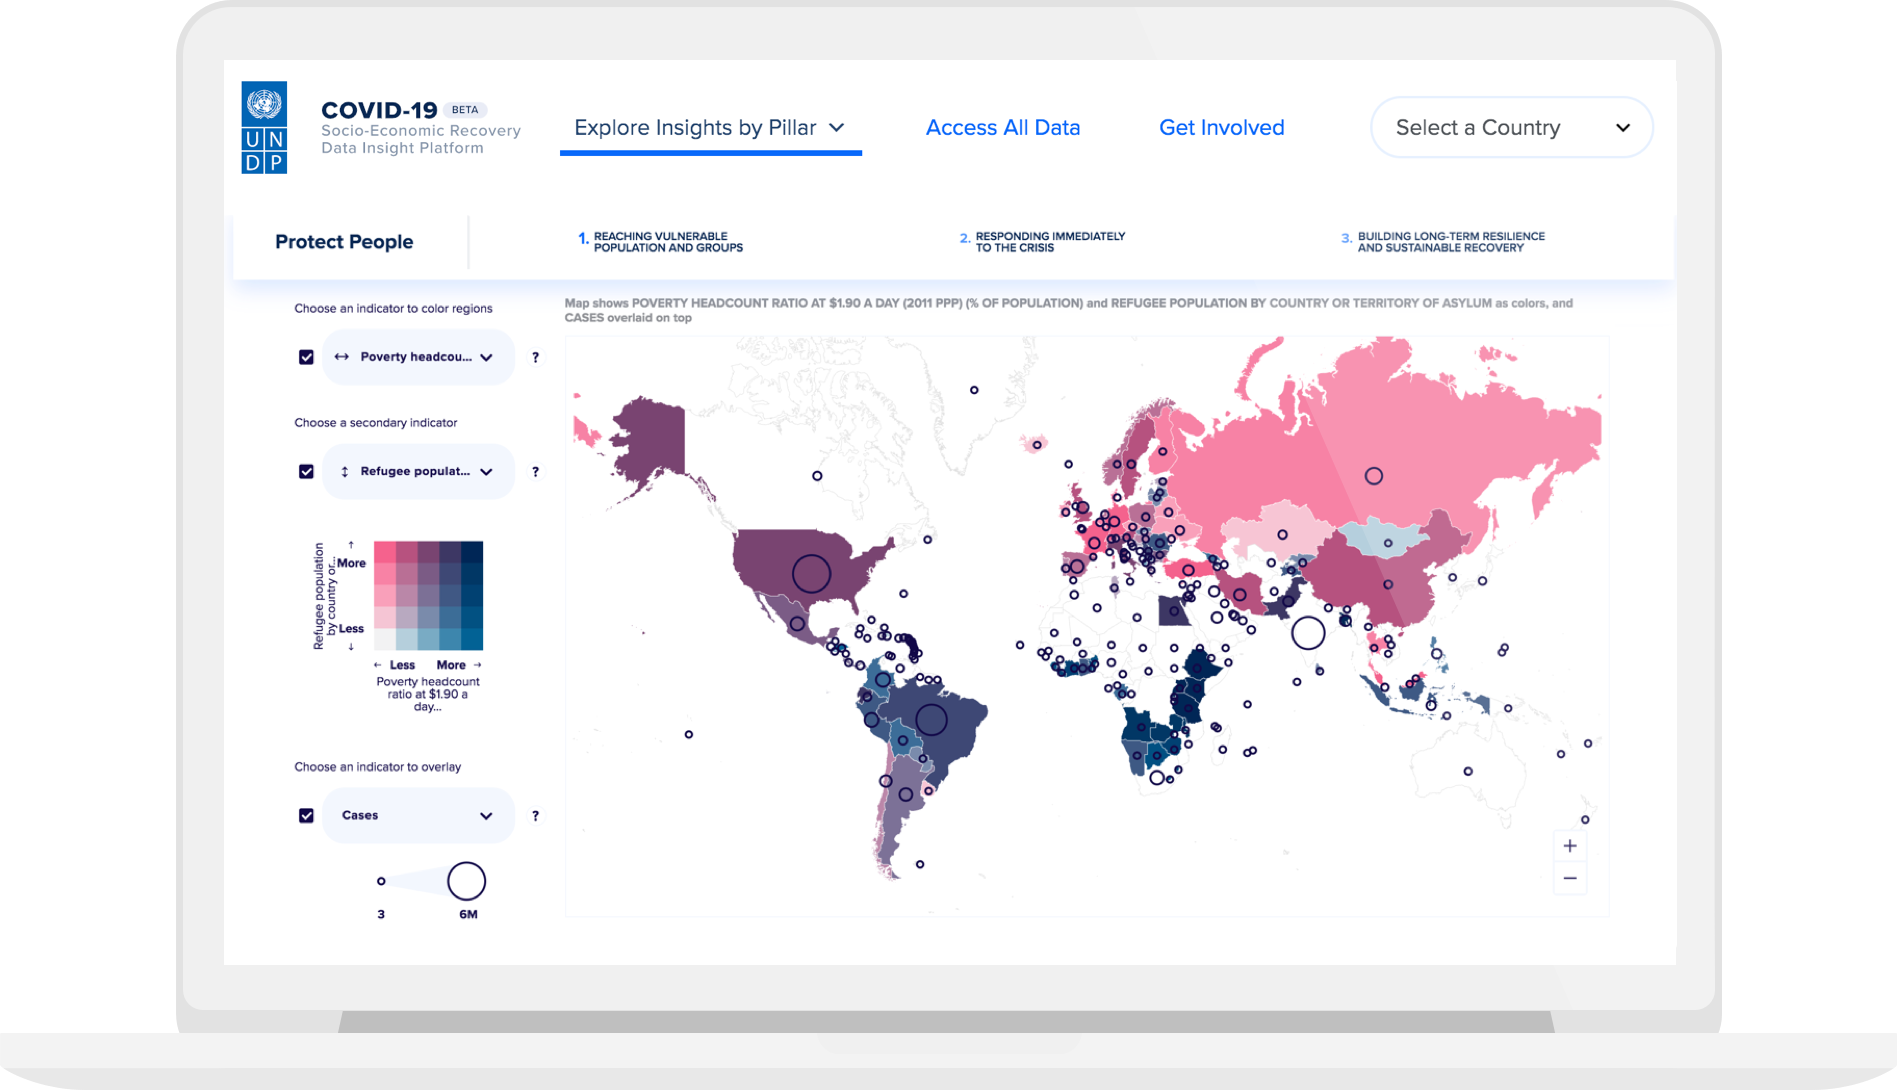
To begin, we created a macro view, through the visualisation of the current state of COVID-19 around the world based on key COVID-19 indicators, such as cumulative confirmed cases, cumulative deaths and fatality rate. This data visualisation gives users a clear, accurate portrait of the severity of the COVID-19 pandemic in various nations and regions.
In order to contextualise these indicators, we added tracking indicators, which display the status of various government and/or socioeconomic initiatives–from reductions in fees and wage subsidies for employers to loans and cash assistance.
Hence, the data visualisation, designed as a bivariate choropleth, enables researchers and policymakers to see the relationships between government and/or socioeconomic initiatives, and the behaviour of the COVID-19 pandemic. Nations or regions that deviate from the norm are highlighted.
COVID-19 and long-term development
In addition to creating data visualisations that give insights into the impact of short-term policies on COVID-19, we visualised the effect of long-term development trajectories. These trajectories incorporate a variety of data, from central government debt and projected unemployment rates to women’s participation in the economy and regulatory performance. They play a major role in determining a nation’s level of resilience and its outlook, in terms of recovery from the pandemic.
Related Projects
The COVID-19 Socio-Economic Recovery Data Insight Platform is one of many of our community service inspired projects that strive to create a kinder, more sustainable society, by drawing attention to current issues in Australia and around the world.
In May this year, we studied the impact of COVID-19 on vulnerable sections of the Australian labourforce, by visualising levels of risk according to occupation. In February, in response to the Royal Commission into Aged Care, we mapped non-compliance notifications and sanctions in aged care facilities around Australia.
We’ve also created several data visualisations concerning economic inequality and poverty in Australia, including this visualisation of low and high income earners in Sydney according to ancestry; this overview of the Australian economy according to three elements (home loans and credit cards held with big banks, yield curves and interest rates compared with those of other nations); and this analysis of homelessness.
Related projects and articles
-
Using dot density maps to visualise complex population data
Article
-
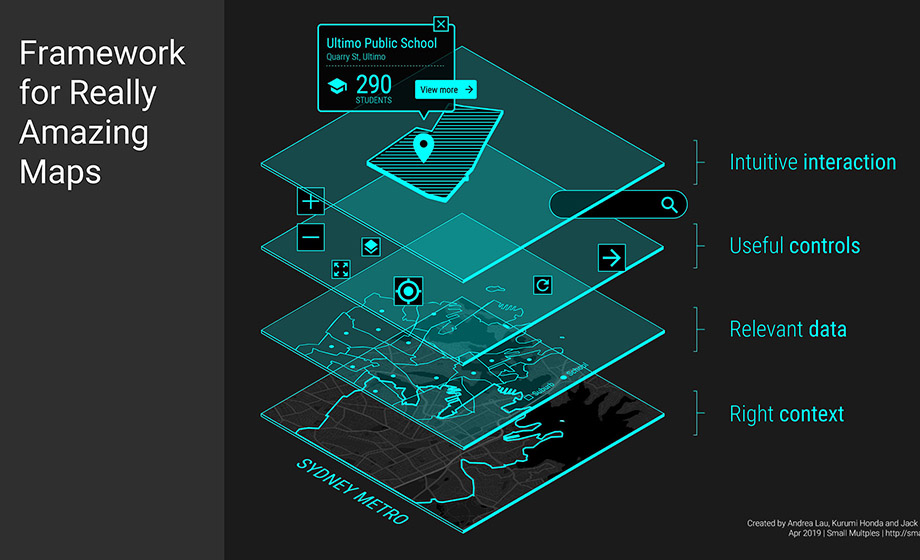
What to think about when designing maps
Article
-
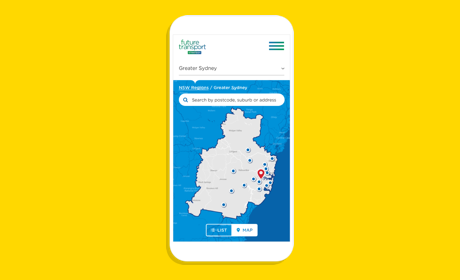
The Future of Transport
Transport for NSW
-
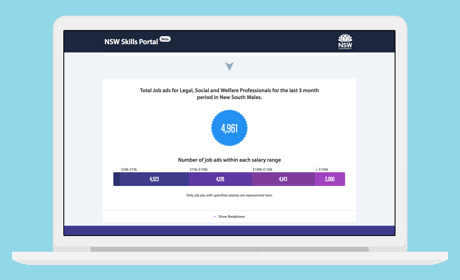
Skills & Occupations Portal
Department of Industry