 View All
How to plan a holiday using data


So many places, so little time. Choosing a destination can be overwhelming, as everyone has an opinion to share. Whether it’s your friend that recounts their amazing “life-changing journey”, your parents reminiscing about travels in their youth, or the unreal instagram destination posts that make you want to pack your suitcase and jump right on that plane.
But where (and when) should you actually go?
While we can’t decide that for you, we can show you how data can help make your holiday a bit better just by optimising your planning.
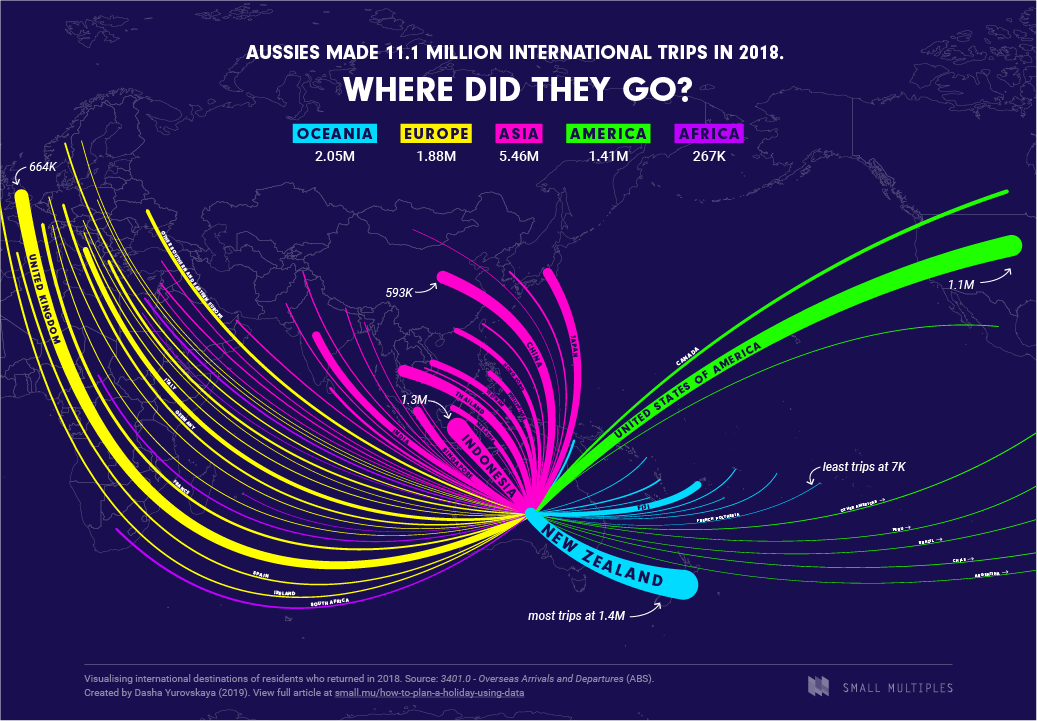
First, we can take a look at the go-to hotspots for Aussies, particularly in the last year. This is a good indicator of popularity of flights, and as a result the likelihood of options you’ll have when booking a flight to these destinations (both in terms of comfort and price variability).
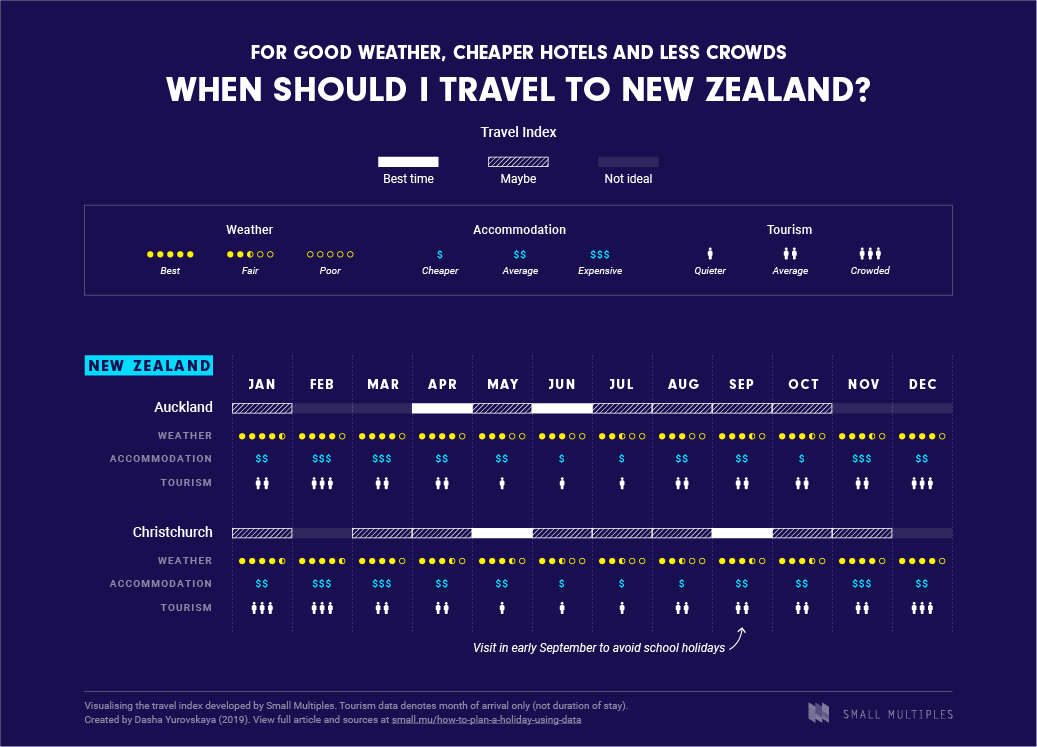
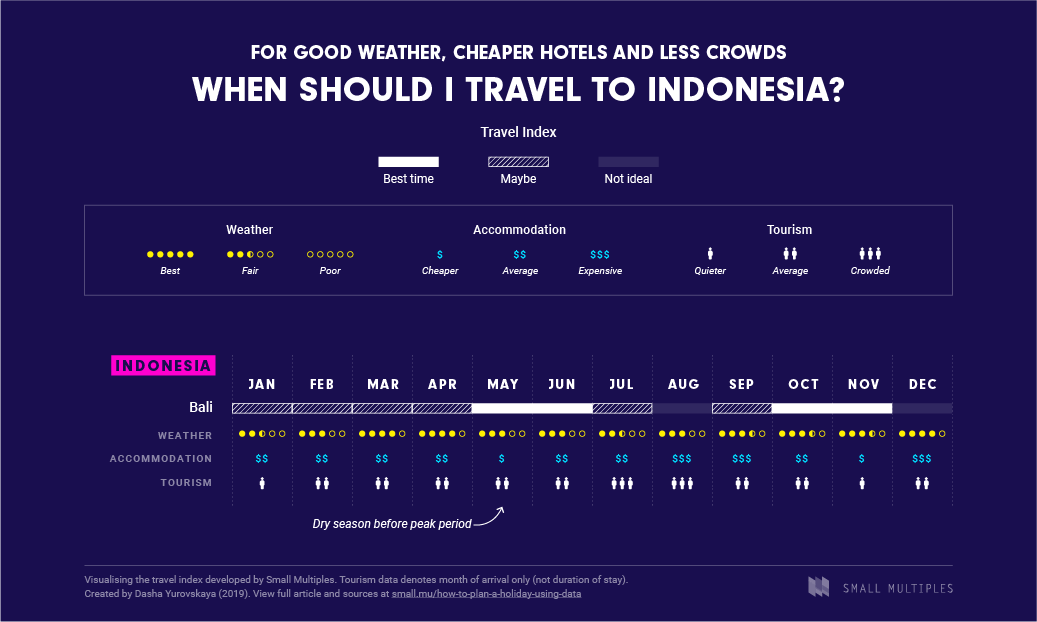
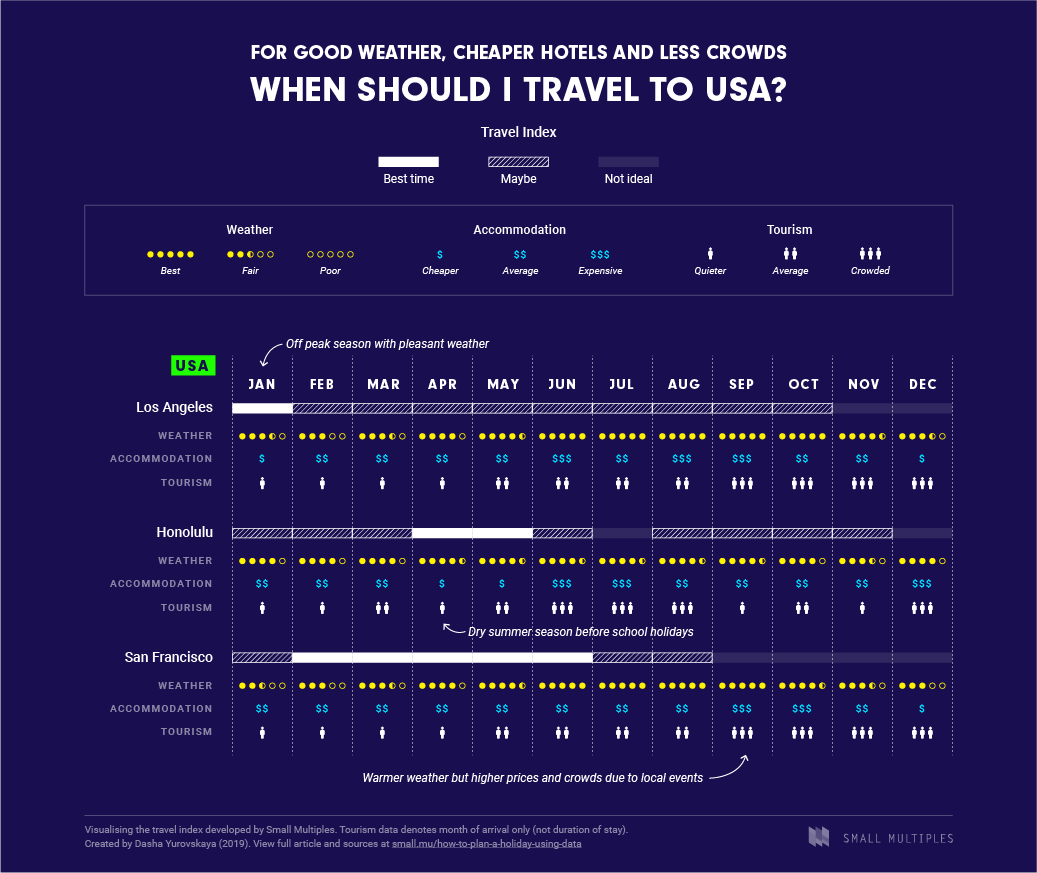
The Australian Bureau of Statistics (ABS) has some interesting movement data which shows the destination and month of return for residents. The extent of travel reaches 11.1 million international trips in 2018, and by categorising these by continent, we can already see that almost half of trips took place in Asia, even though the number one destination is still New Zealand (1.4 million trips), followed by Indonesia (1.3 million trips) and the United States (1.1 million trips).
But how is this useful to you? Well it all depends on your preferences.
If you love to go off the beaten track, then it could be a list of destinations to avoid. Imagine the hoard of tourists, overcrowded attractions and overpriced accommodation - quite the idyllic vacation.
However, if you’re in the majority of Aussies who doesn’t mind the popularity of these (65% to be exact), then you could be enjoying competitive prices, enticing landscapes and an abundance of activities if you go at the right time.
Knowing when to go can make or break your holiday, as even the most tourist filled destinations can be quite enjoyable during the low and shoulder seasons. But a quick internet search is generally unhelpful, as most websites list vague month ranges that lack any evidence to support their statements.
Taking this as a challenge to provide more objective answers that are relevant to Aussies, we gathered ABS overseas movements data so that we could plot the levels of return from specific countries by month, and then categorise these by continent.

The radial chart shows a monthly breakdown of Aussie travel patterns, and it’s no surprise that most Aussies come back from a Christmas break in January. But you can also see the three smaller peaks in travel, distributed around the school term holidays (and some public holidays) in Australia. The data gets a bit more interesting when we dive deeper and look at the top 10 countries.
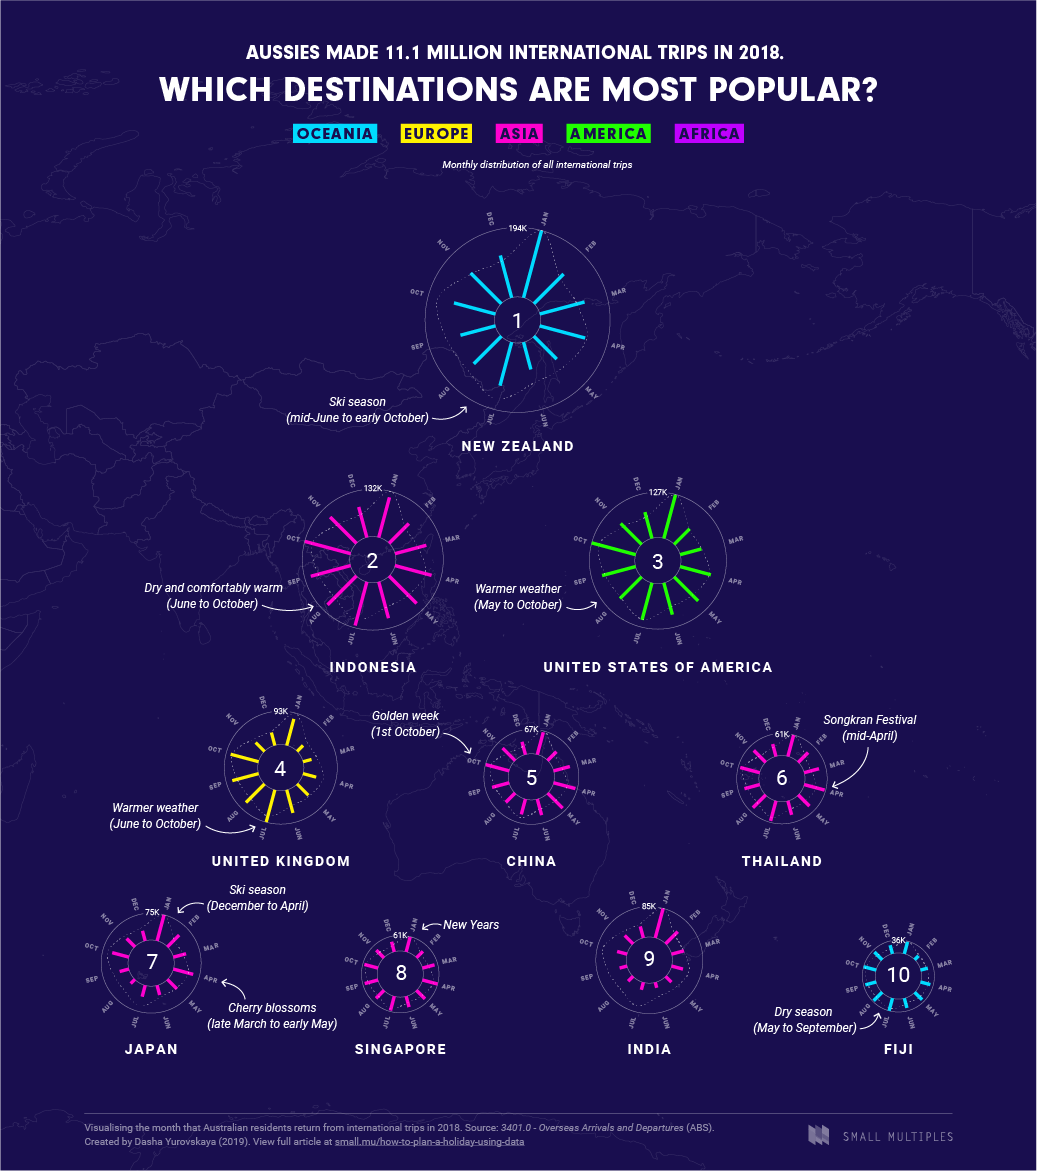
However, while this is useful to determine when Aussies come back from a vacation, it doesn’t necessarily correlate to the peak seasons of each destination.
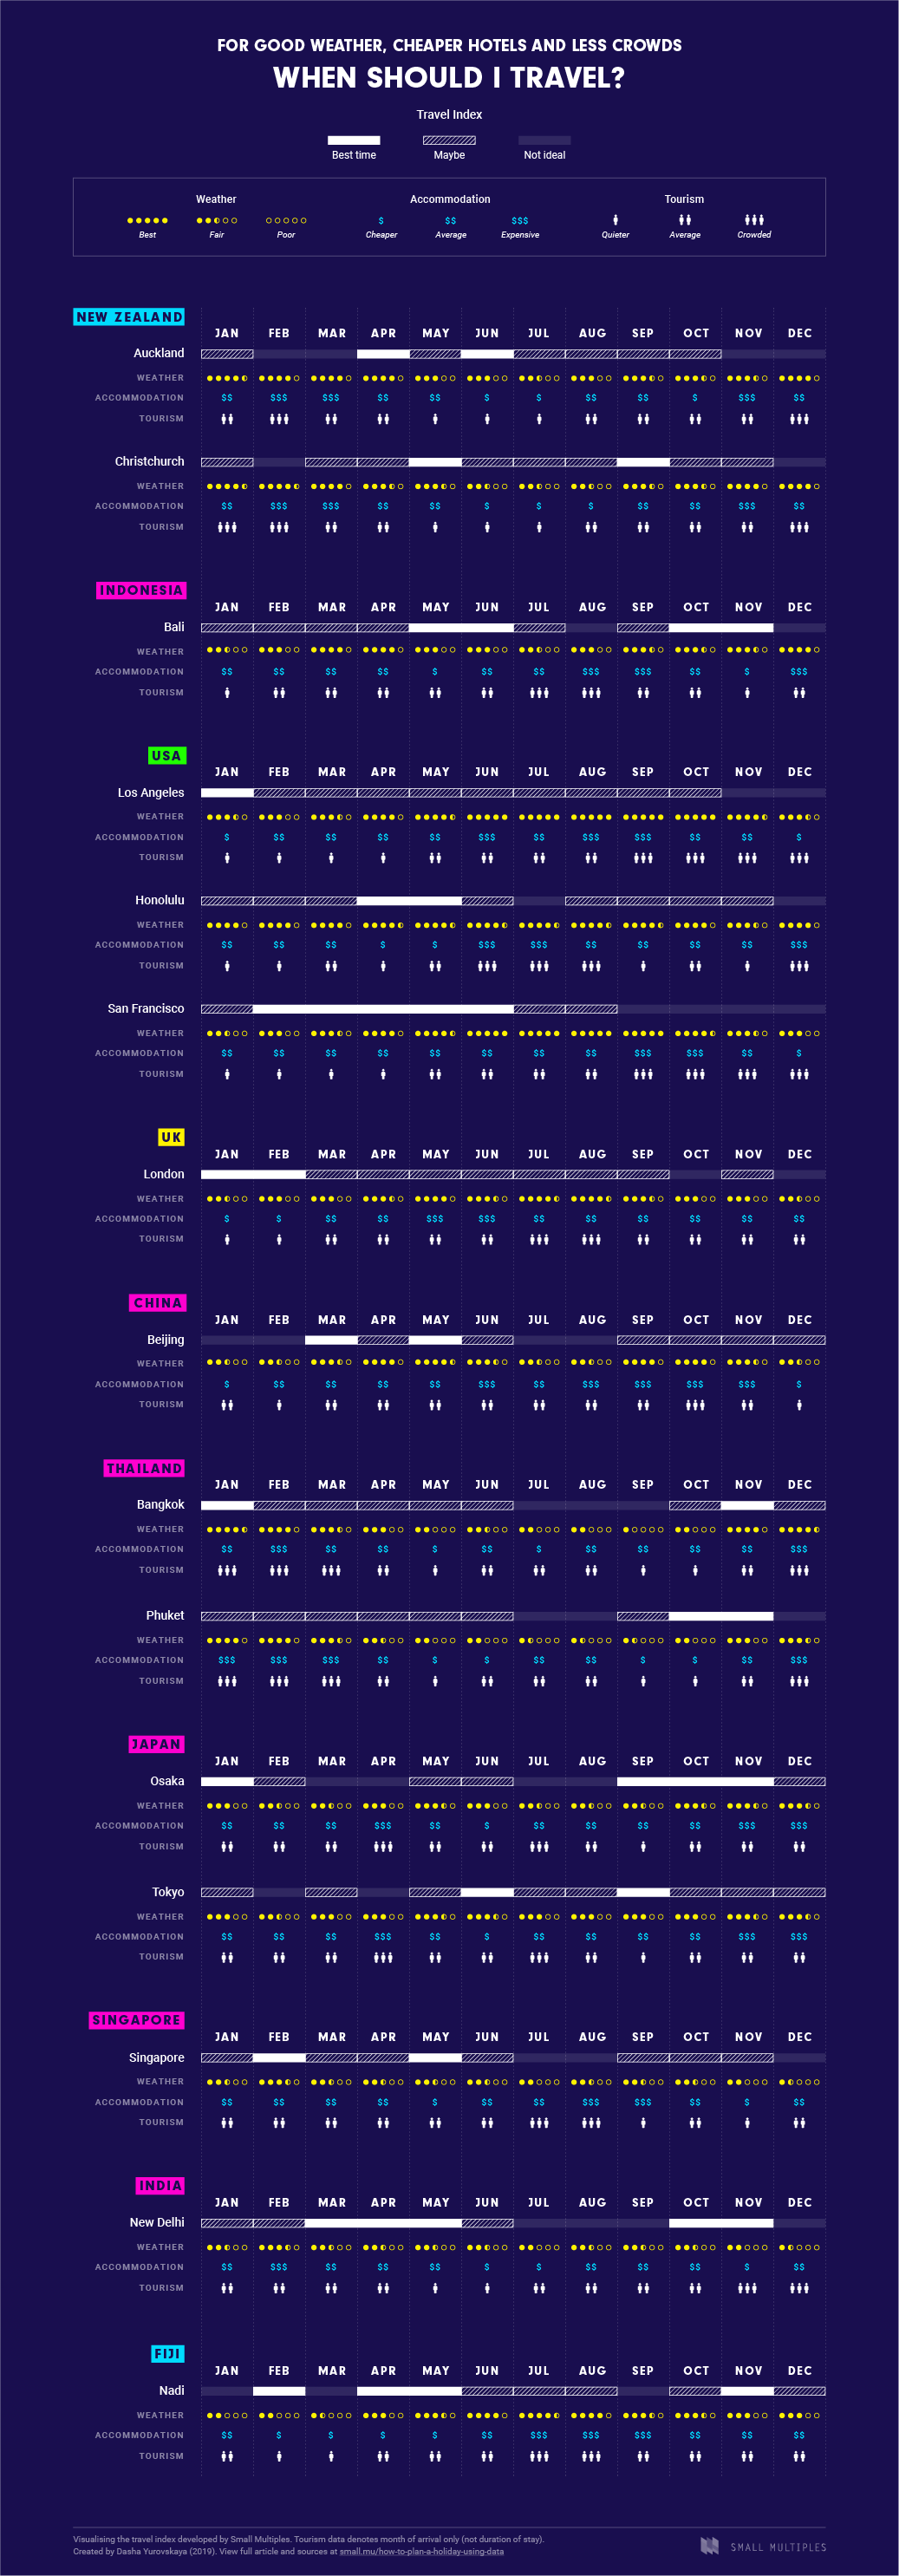
Tourism levels Unfortunately, this data is not readily available from one source (at least as open data). Instead, we searched through each country’s official tourism or open data website and converted absolute visitor arrivals into percentages - based on the maximum number of tourists in any one month per city. It’s important to note that these figures show month of arrival, and therefore don’t reflect duration of stay. This means that even though there were fewer arrivals in February in Beijing (whereas one would expect a lot more for the Lunar New Year), it’s more likely that the majority arrived in late January for the event. However, apart from this anomaly (which needed to be manually adjusted), the tourism levels depicted should be representative of crowds.
Accomodation Prices Trivago, the hotel comparison site, has released a preview of their stored hotel price data in a tableau dashboard, in order to promote their paid Hotel Manager Pro service. Luckily, the data readily available was enough for us - showing monthly averages of price per night for a standard double room. We utilised these averages by converting these to percentages in order to place months into buckets of “Cheaper”, “Average” and “Expensive”. As some cities are intrinsically more expensive than others (New Delhi compared to San Francisco).
Weather Finally, we sourced weather data from NOAA, which was combined into a weather index (also as a percentage). We conducted a variation on the 10-point weather rating method - created by Hugo Poppe and later developed by Henry Geurts - since we only were able to get temperature and rainfall data for all cities. This resulted in a comparable score across all cities, unlike accommodation prices and tourism levels (all of which have varying ranges for each city).
By averaging all three vital components, we can visualise the best and worst months to visit major cities in our top 10 countries. While tourism levels, accommodation prices and weather all have an equal weighting in our formula, we understand that some factors may be more important than others to different people. Therefore, if we pursue this project further, we would definitely incorporate some personalisation into an interactive tool that allows the user to control their preferences.
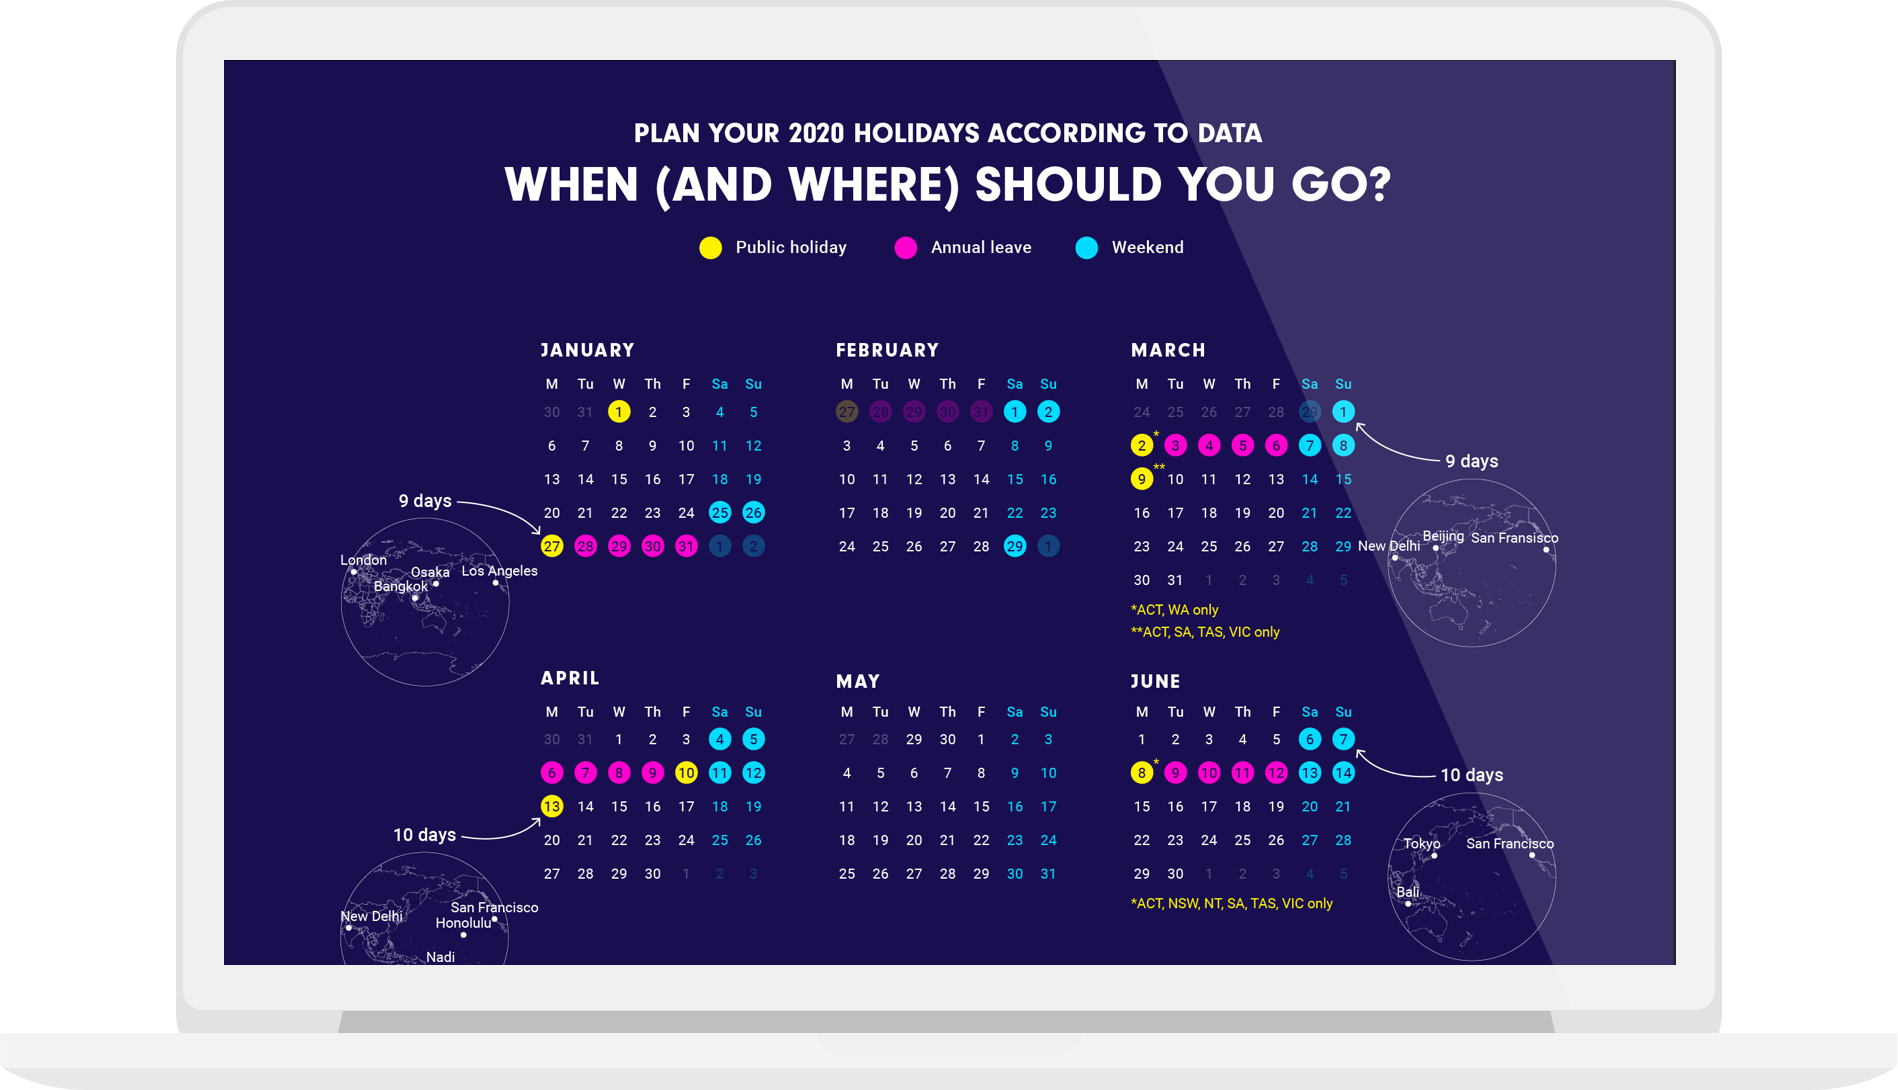
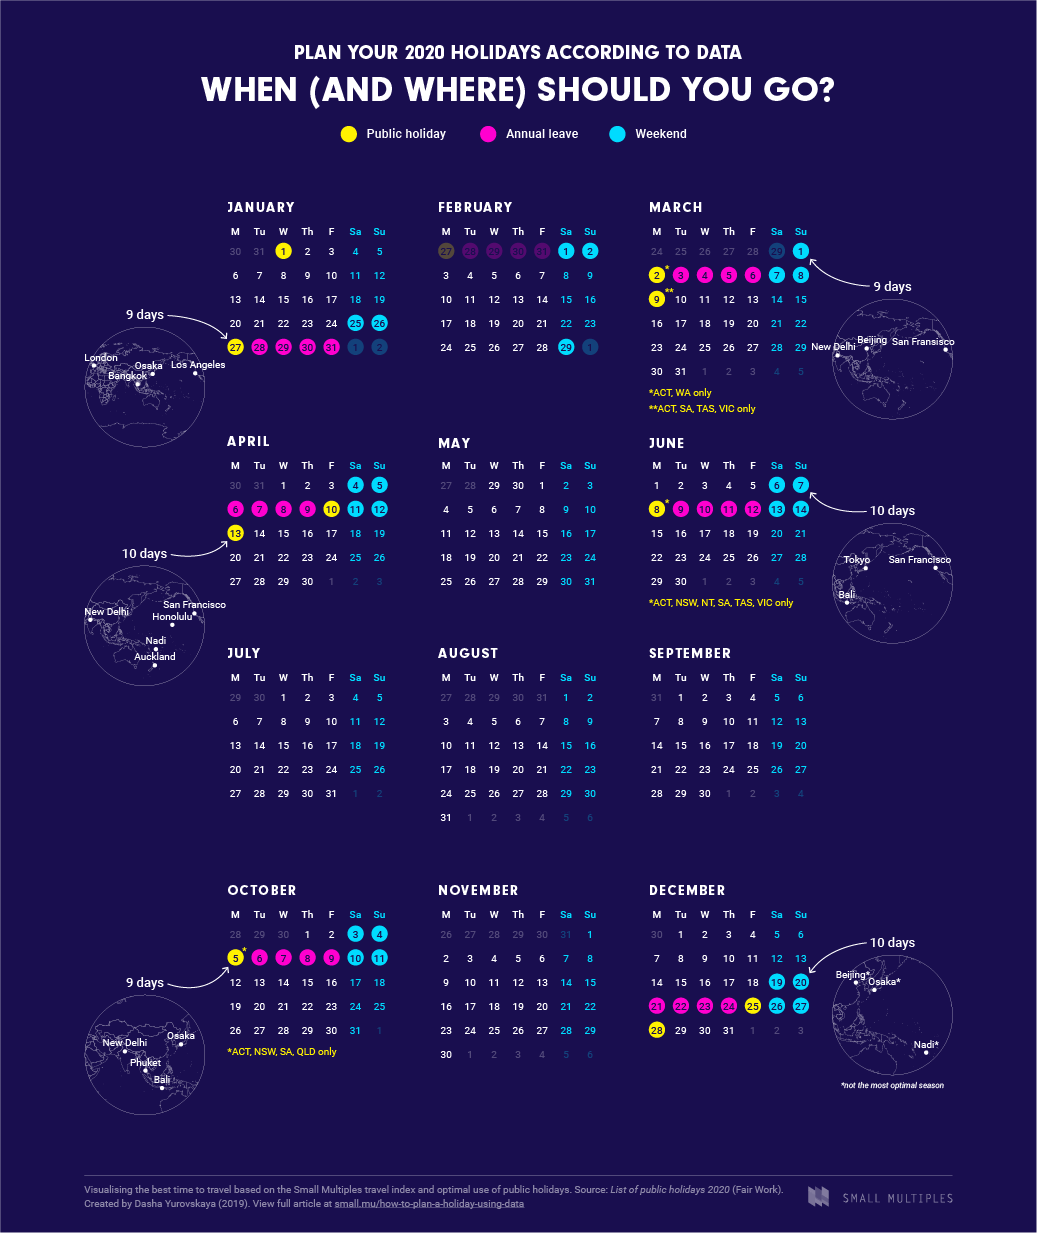
As 2019 is in full swing, we decided to help our fellow long-term planners and recommend the following destinations and dates for 2020. These are based on our travel index, optimal periods to take annual leave and insider knowledge of destinations (thanks to our multi-cultural office).
Use this as a rough guide, and just maybe it’ll give you that final push to book your holiday.
Australian Bureau of Statistics, 2018, 3401.0 - Overseas Arrivals and Departures, Australia, Dec 2018, electronic dataset, viewed 1 April 2019, http://www.abs.gov.au/AUSSTATS/abs@.nsf/DetailsPage/3401.0Dec%202018?OpenDocument
Weather data National Oceanic and Atmospheric Administration, 2018, Global Summary of the Day, electronic dataset accessed via Google BigQuery, viewed 1 April 2019, https://www7.ncdc.noaa.gov/CDO/cdoselect.cmd?datasetabbv=GSOD&countryabbv=&georegionabbv=
Accommodation data Trivago, 2018, Trivago Hotel Price Index, electronic dataset [Tableau dashboard], viewed 8 April 2019, https://businessblog.trivago.com/trivago-hotel-price-index/
Tourism data Stats NZ, 2018, International Travel [January 2018 - December 2018], electronic dataset, viewed 29 March 2019, https://www.stats.govt.nz/information-releases/international-travel-december-2018
Statistics Indonesia, 2018, Number of Foreign Tourists Arrival in 2017 - 2018, graph data [Highcharts], viewed 29 March 2019, https://www.bps.go.id/
National Travel and Tourism Office, 2017, Non-Resident Arrivals to the United States: Overseas, Canada, Mexico & International, electronic dataset, viewed 29 March 2019, https://travel.trade.gov/view/m-2017-I-001/index.asp
Department of Business, Economic Development & Tourism, 2018, Monthly Visitor Statistics, electronic dataset, viewed 12 April 2019, http://dbedt.hawaii.gov/visitor/tourism/
Office for National Statistics, 2018, OS visits to UK:All visits Thousands-NSA, electronic dataset, viewed 15 April 2019, https://www.ons.gov.uk/peoplepopulationandcommunity/leisureandtourism/timeseries/gmaa/ott
Ministry of Tourism and Sports, 2018, Statistics of foreign tourists traveling to Thailand in 2018, electronic dataset, viewed 16 April 2019, https://www.mots.go.th/allcont.php?cid=502&filename=
Japan Tourism Statistics, 2018, Trends in the Visitor Arrivals to Japan by Month, Japan National Tourism Organization, electronic dataset, viewed 29 March 2019, https://statistics.jnto.go.jp/en/graph/#graph–inbound–travelers–transition
Singapore Tourism Board, 2018, International Visitor Arrivals, electronic dataset, viewed 29 March 2019, https://www.stb.gov.sg/content/stb/en/statistics-and-market-insights/tourism-statistics/international-visitorarrivals.html
Ministry of Tourism India, 2017, _India Tourism Statistics 201_8, electronic dataset, viewed 29 March 2019, http://tourism.gov.in/market-research-and-statistics
Fiji Bureau of Statistics, 2018, Visitor Arrivals Statistics, electronic dataset, viewed 29 March 2019, https://www.statsfiji.gov.fj/index.php/statistics/tourism-and-migration-statistics/visitor-arrivals-statistics
Visit California, 2018, 2018 October Overseas and Mexico Arrivals at California POE, electronic dataset, viewed 12 April 2019, https://industry.visitcalifornia.com/Research/Report/2018-October-Overseas-Arrivals-at-California-POE
Bali Government Tourism Office, 2018, The Number of Foreign Tourists Arrival to Bali By Month, viewed 14 April 2019, http://www.disparda.baliprov.go.id/en/Statistics2
China Academic Journals Electronic Publishing House, 2011, Number of Received Inbound Tourists, China Statistical Yearbook Database, electronic database, viewed 14 April 2019, http://tongji.oversea.cnki.net/oversea/Dig/Monthdata.aspx
Public holidays Fair Work Ombudsman, List of public holidays 2020, Australian Government, viewed 17 April 2019, https://www.fairwork.gov.au/leave/public-holidays/list-of-public-holidays/list-of-public-holidays-2020
Related projects and articles
-
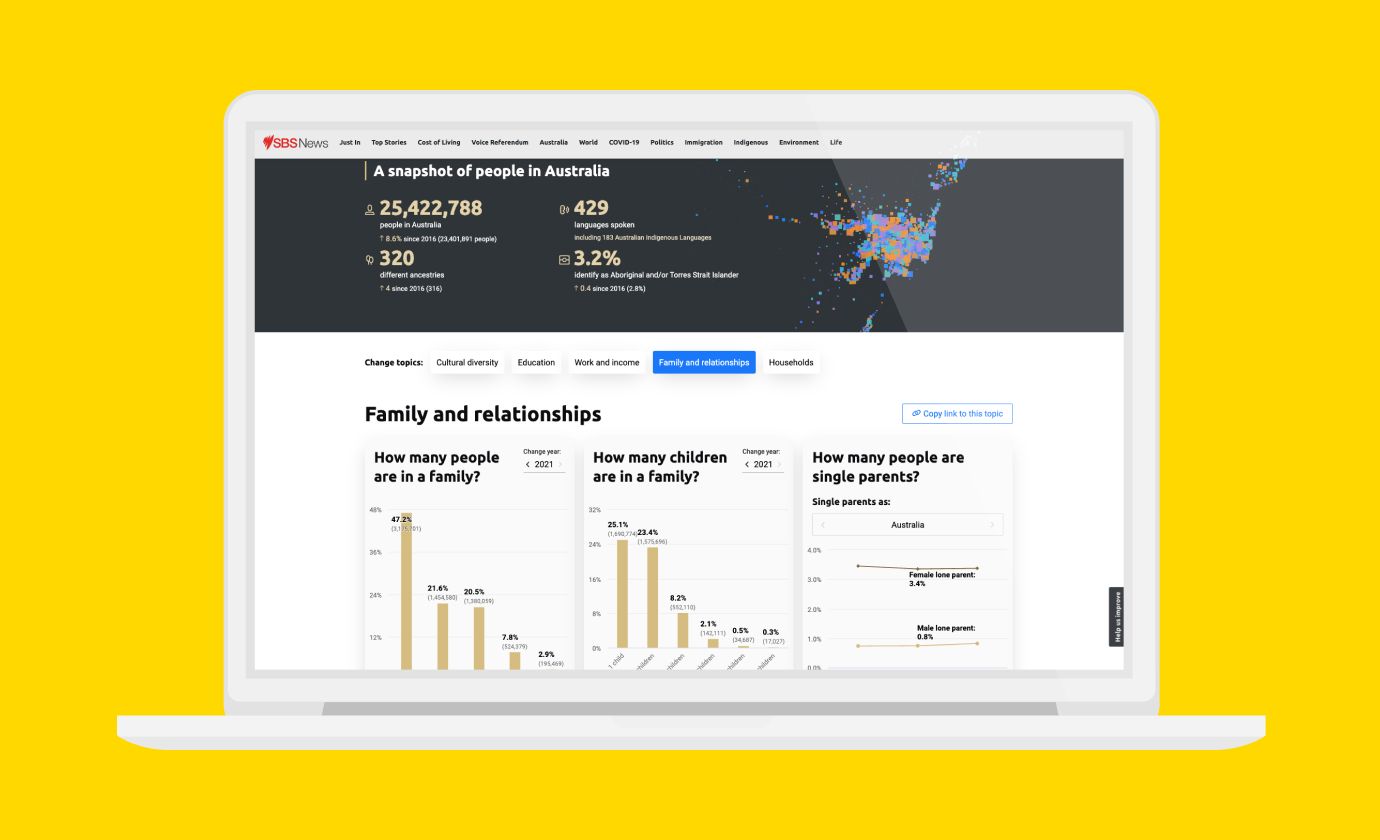
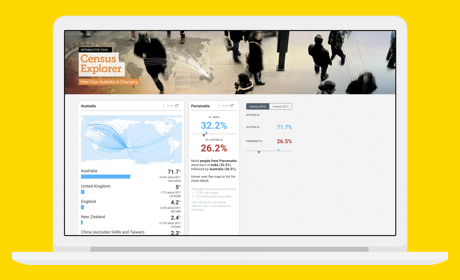
Improving Community Access to Census Data
Special Broadcasting Service (SBS)
-

Data Visualisation in Government Design Systems
Article
-
5 Tips for Animating Spatial Data
Article
-
Census Data Explorer
SBS