View All
Improving Community Access to Census Data


The Challenge
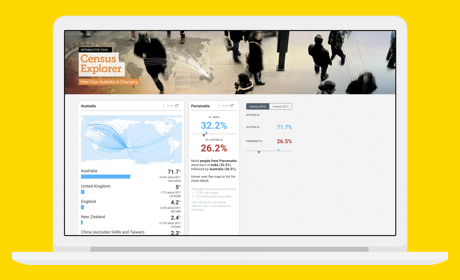
SBS wanted to bring a wealth of information about Australian people from three censuses spanning over a decade to an audience of 25.4 million people across eight different languages. This endeavor posed significant complexities due to the sheer scale and detail of the data, making it a truly ambitious undertaking.
One of the primary challenges we faced was the sheer quantity of data available from the three censuses over ten years. The amount of information was vast, and extracting meaningful insights while maintaining data accuracy and integrity demanded meticulous attention to detail and sophisticated data handling techniques.
Additionally, catering to a vast and diverse audience presented an additional layer of complexity. Translating the content while ensuring the data’s accuracy and contextual relevance in each language required an in-depth understanding of cultural nuances and linguistic subtleties.
The Solution
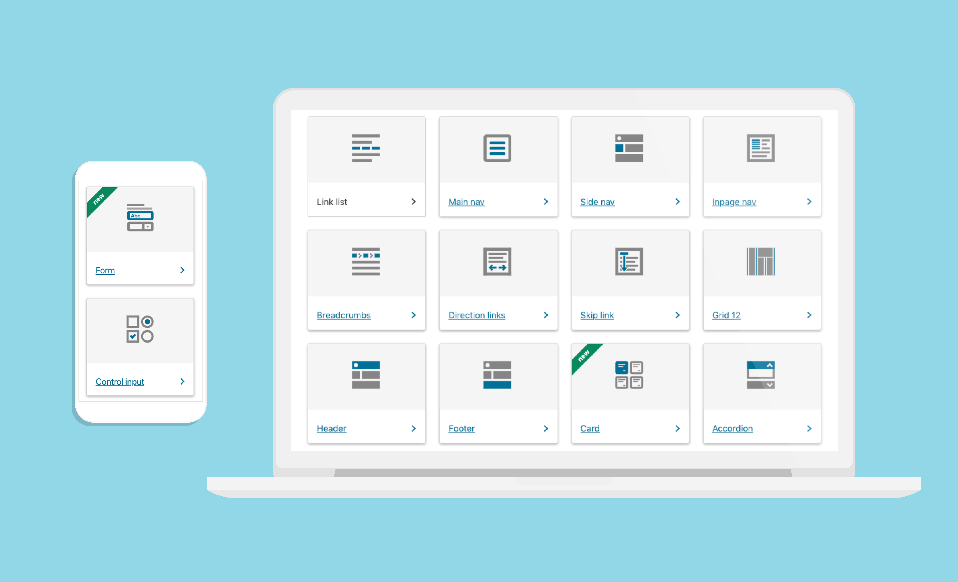
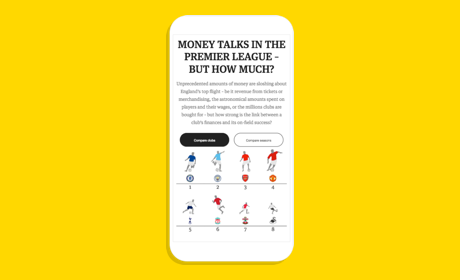
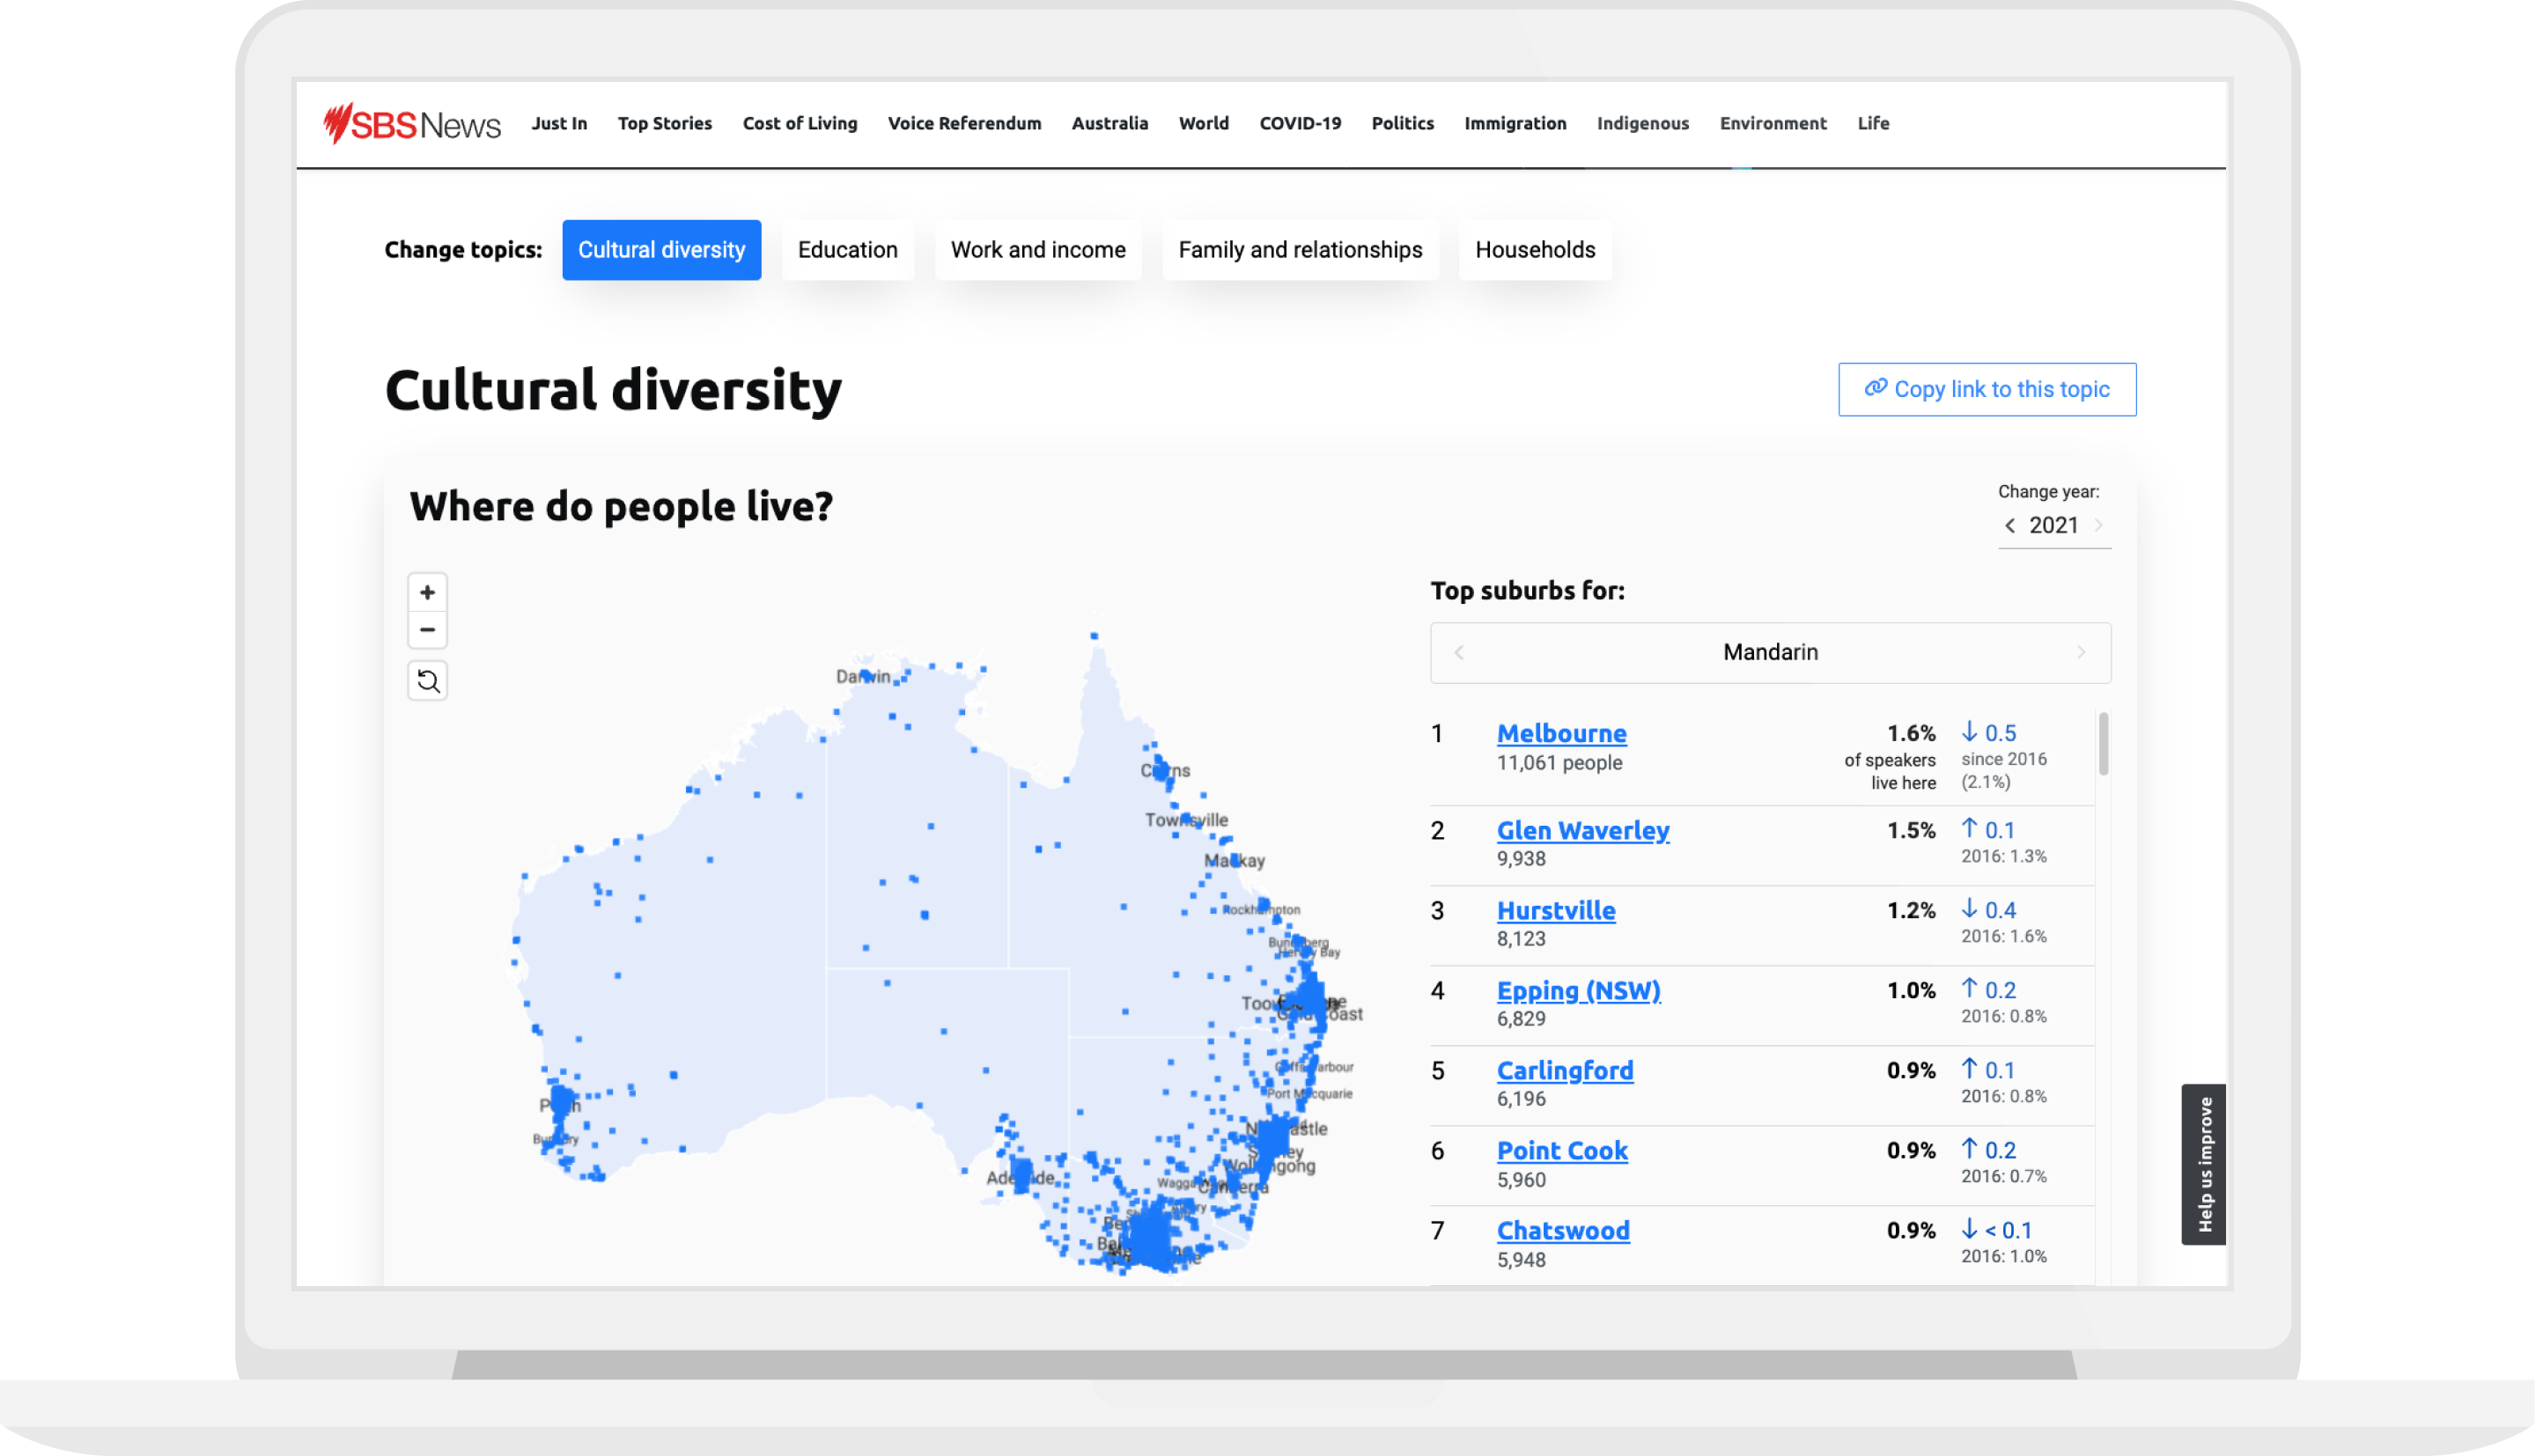
We transform the overwhelming volume of data into clear, concise, and visually compelling representations. By leveraging interactive charts, graphs, and infographics, we simplified complex insights, making them accessible to a diverse audience with varying levels of data literacy.
Next, we collaborated with a team of skilled translators and language experts who were well-versed in the target languages and cultural contexts. This allowed us to ensure accurate translations and cultural relevance while preserving the integrity of the data’s meaning.
The data explorer was optimised to accommodate multiple languages seamlessly, ensuring a smooth user experience regardless of the audience’s language preference.
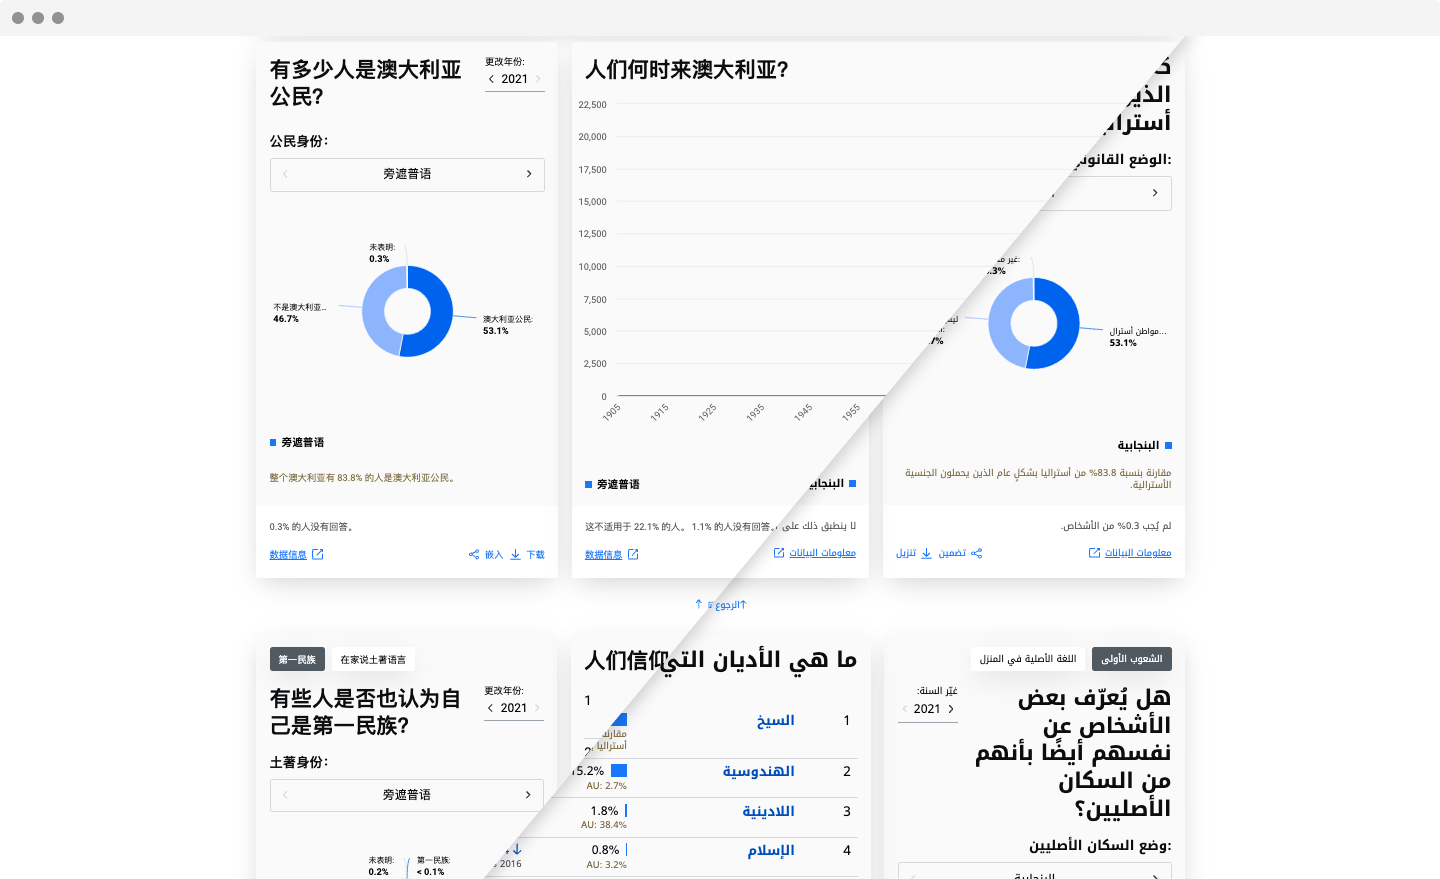
Census data can be viewed in multiple languages such as Chinese and Arabic
We used the Highcharts framework as a foundation to expedite development while customizing the user experience and tailoring visualisations to suit their intended purpose. By delving into the Highcharts API, we fine-tuned the user interface, and seamlessly integrated them with the data back-end. We extended Highcharts' capabilities with custom JavaScript code to create bespoke chart types and meet unique project requirements.
Throughout the project, communication and collaboration were pivotal. We engaged closely with our client to understand their objectives and incorporate their feedback at every stage of development, ensuring the final product aligned perfectly with their vision.