 View All
How is your local council doing financially?
The Queensland Audit office has a wealth of financial data about local councils, which they wanted to make publicly available and easy to explore.


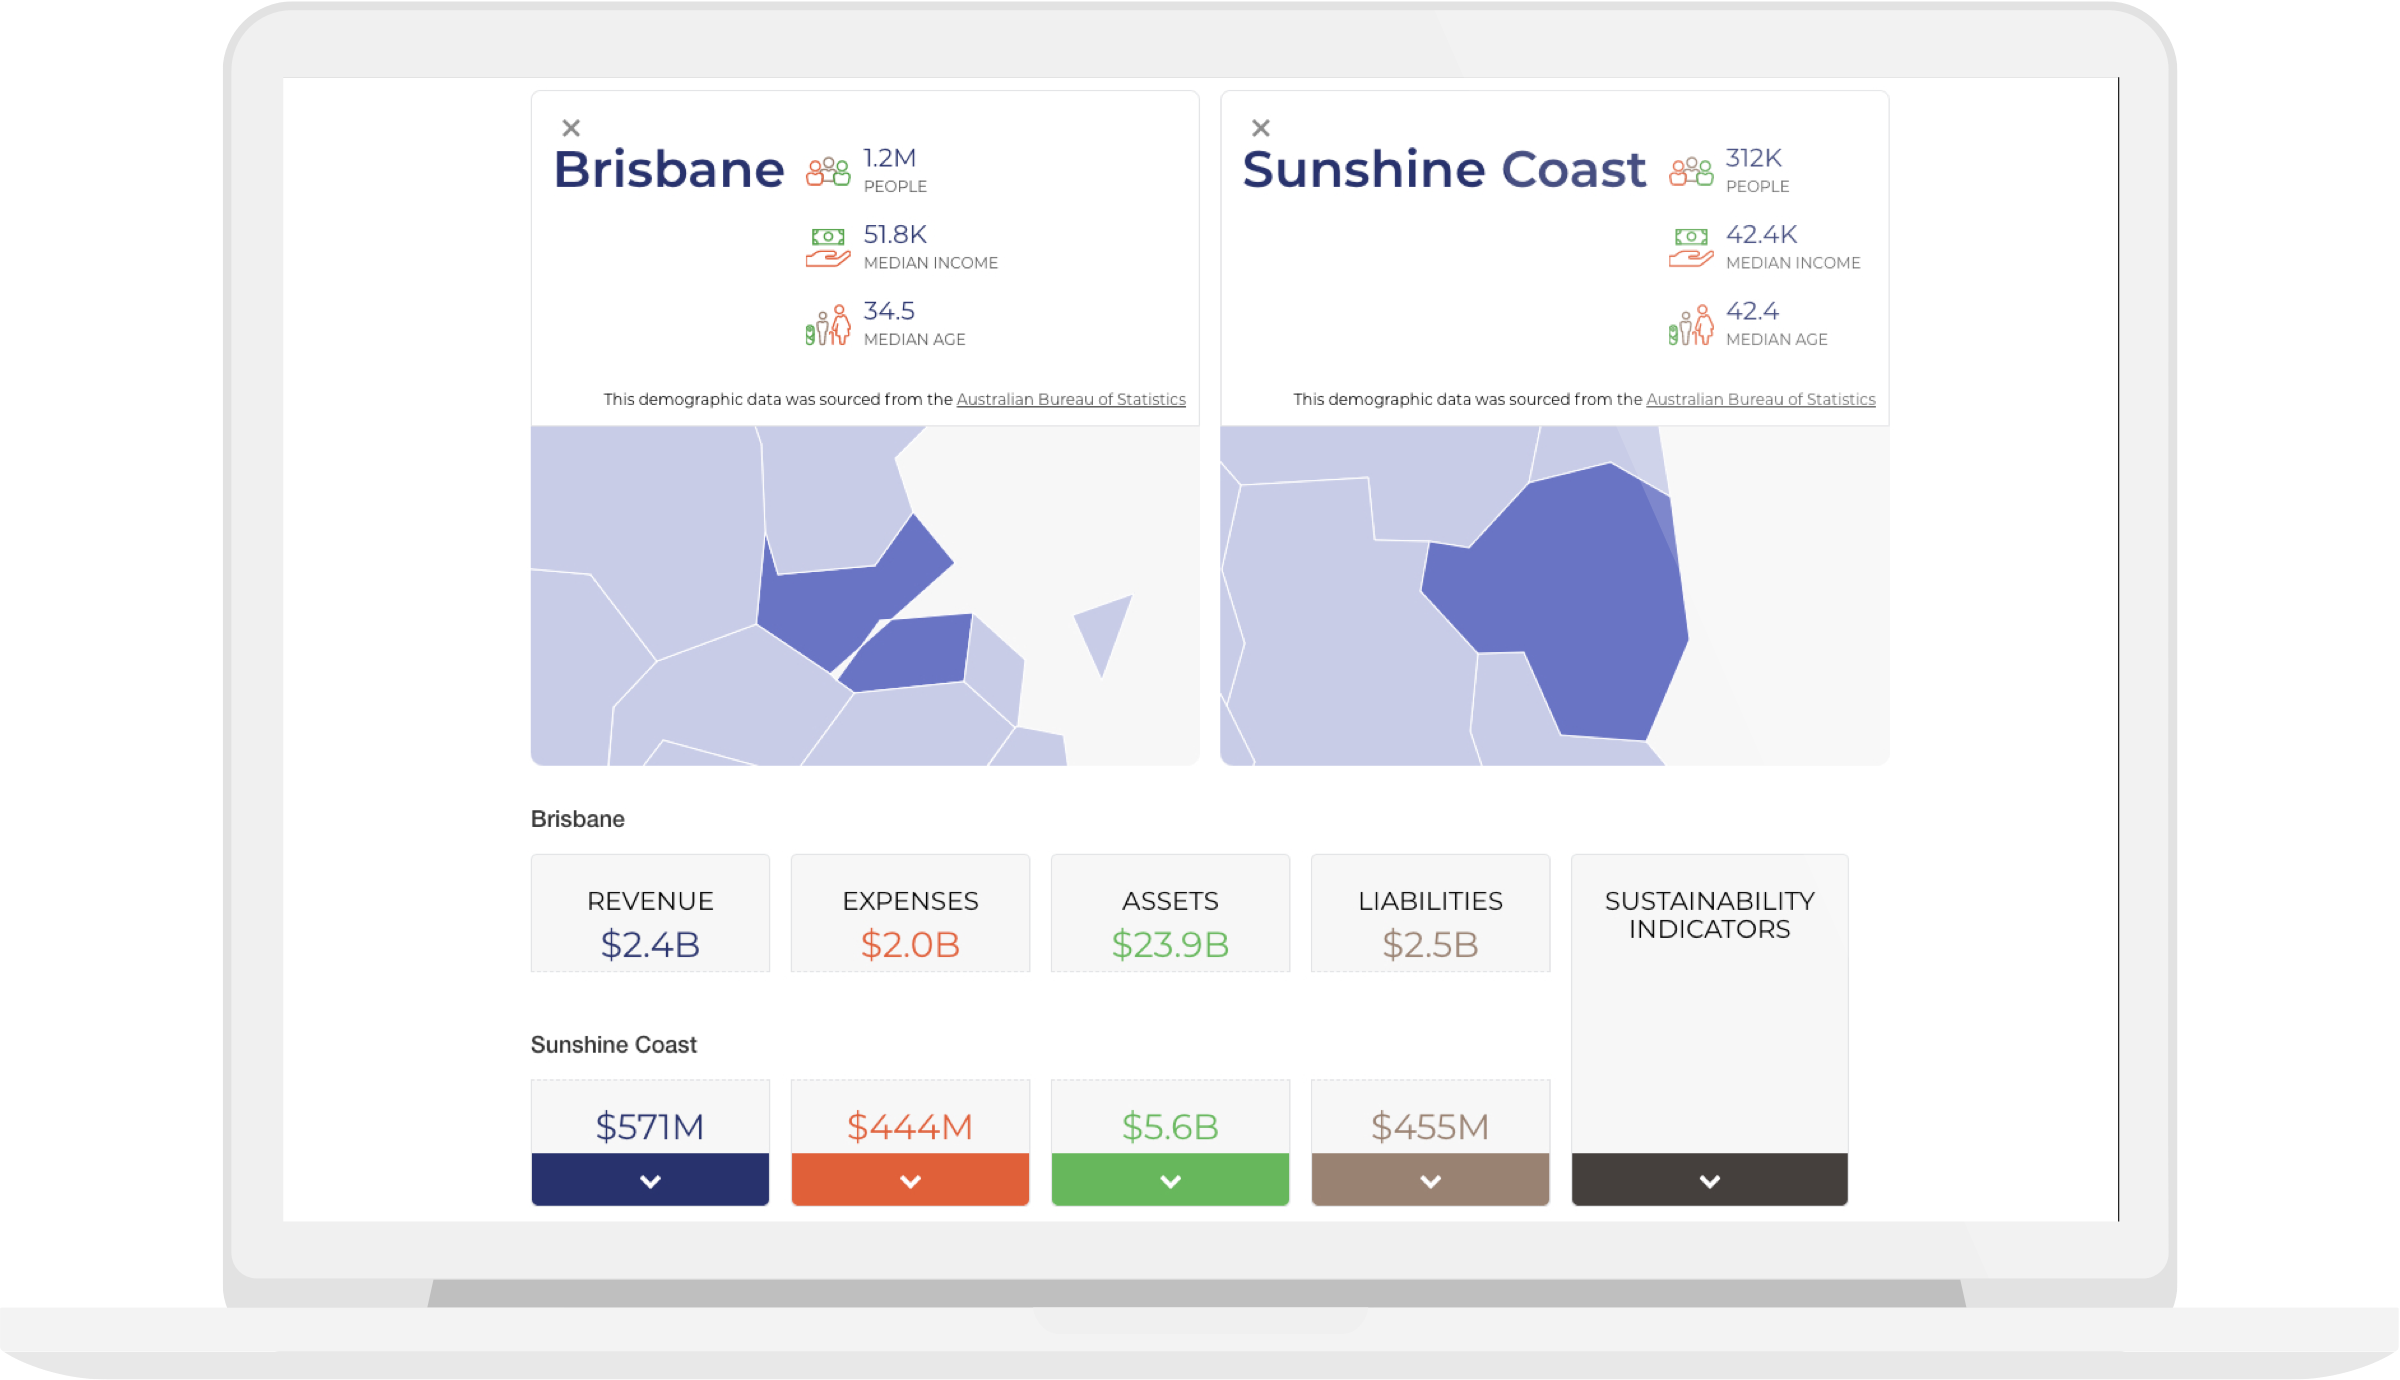
How well do you understand your local council’s finances? The Queensland Audit Office’s annual audit covers every local government area in Queensland, but this is hard to navigate in spreadsheet form.
Our interactive tool includes data on revenue, expenses, operating costs, assets, liabilities and sustainability indicators.
Related projects and articles
-
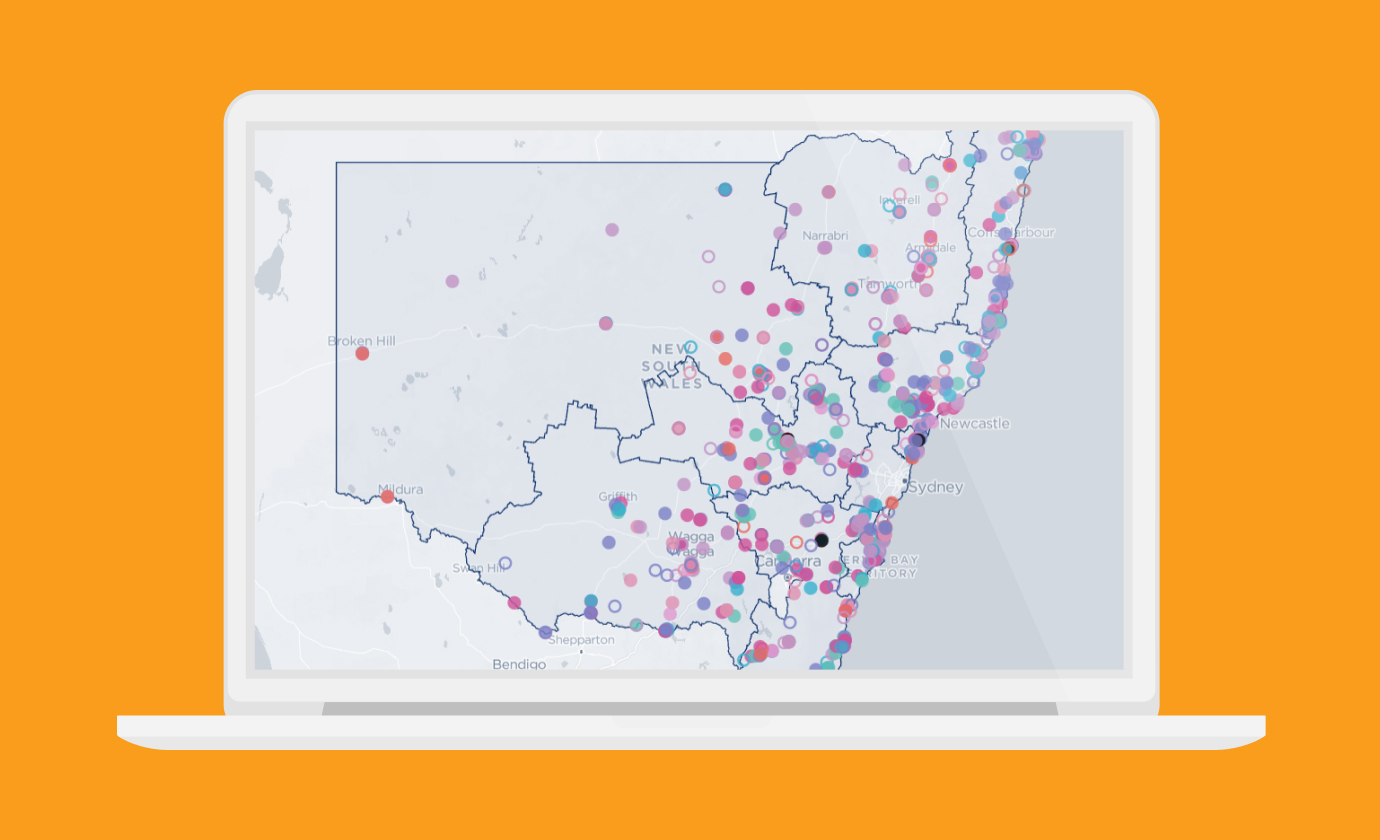
Mapping Project Activities and Funding in Regional NSW
Regional NSW
-

Andrea Lau in conversation with Andy Kirk: Explore Explain podcast
Article
-

Mapping Indigenous Literacy Foundation's Reach and Transformation
Indigenous Literacy Foundation
-
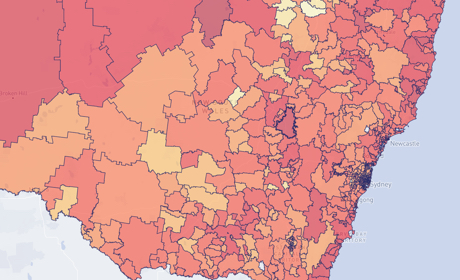
Occupational Risk due to COVID-19 in NSW
Article