 View All
Data Visualisation at General Assembly
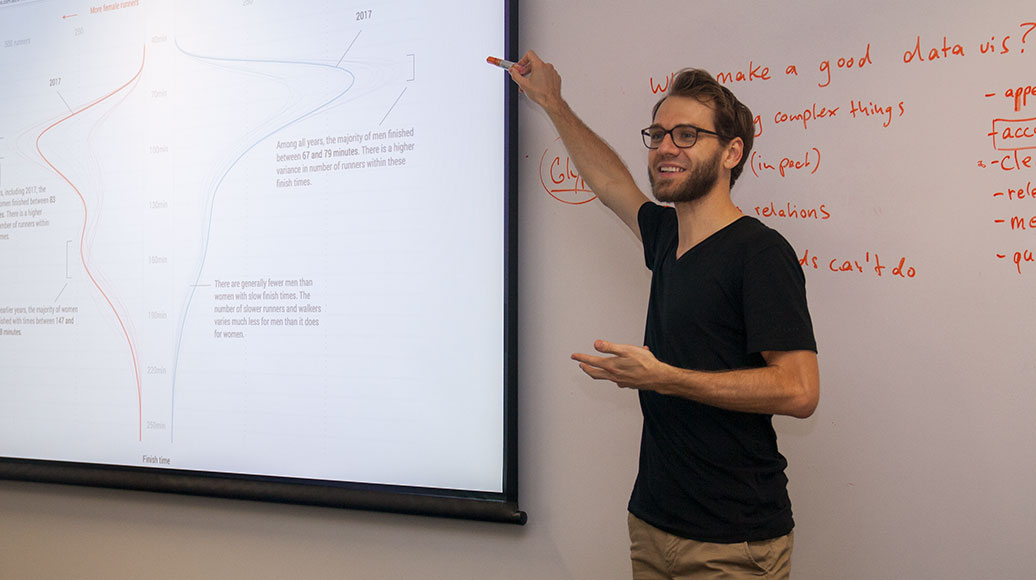
We ran a Data Visualisation short course at General Assembly for over two years, introducing beginners to the topic from the ground up.


Learning to create powerful data-driven graphics
We crafted our course for people who are new to the topic and want a good general understanding of key principles for analysing, designing and communicating data.
Data Visualisation is becoming a critical tool in communicating with customers, understanding trends, building better tools and analysing business processes.
The course took students through the basics of data visualisation from the history, analysis of data and designing great interfaces for all types of users.
Course takeaways
- Understand the importance of data visualisation.
- Get to know key terminology and types of data visualisation.
- Learn best practises based on analysing good and bad data visualisation.
- Make connections between the story you want to tell and the data to convey it.
- Walk-through the typical design process to create visualisations.
- Tools and resources for practising and learning more about data visualisation at home.
Would you like one of our data vis specialists to teach a course at your company? Or maybe give a talk? Get in contact.
Related projects and articles
-
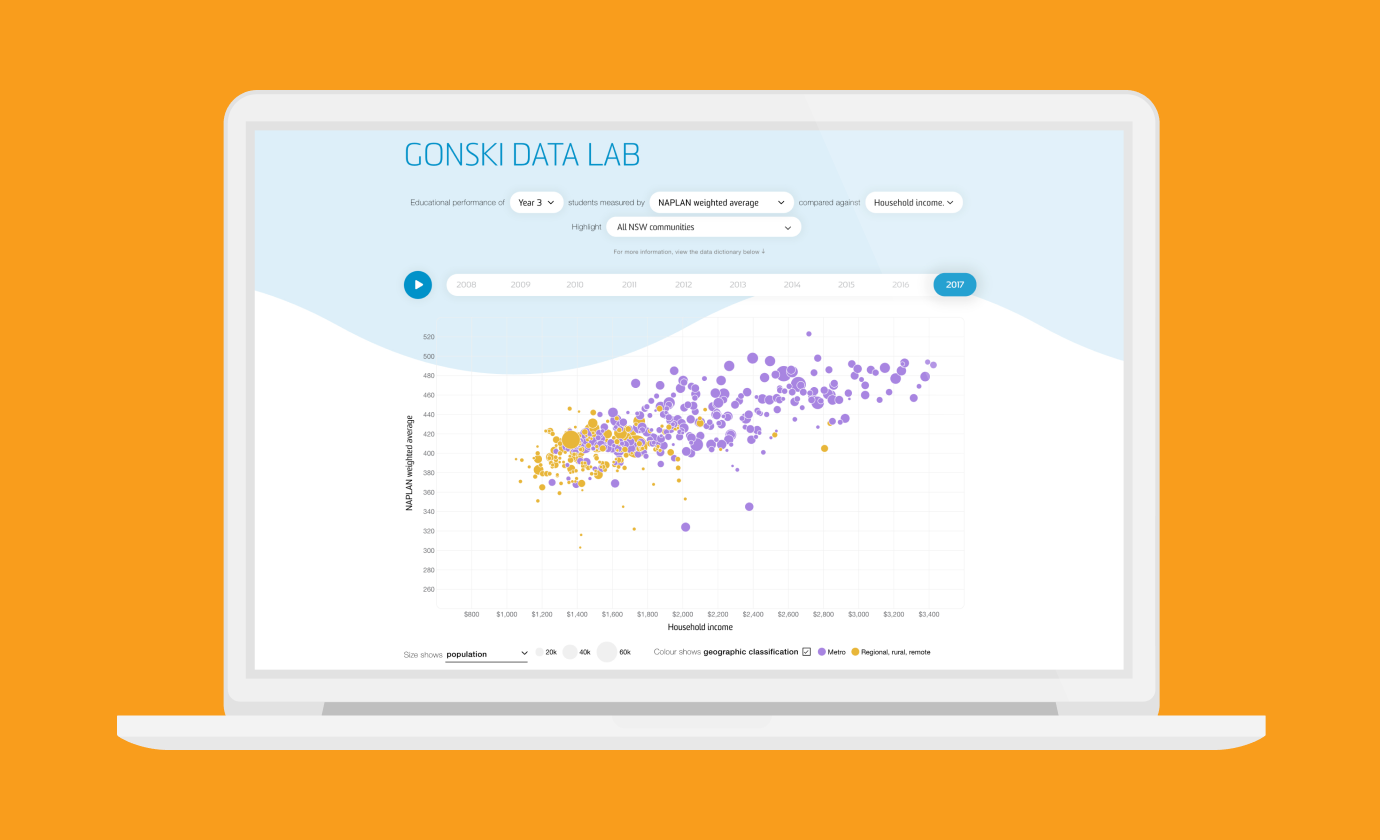
Revealing the social factors behind school performance
Gonski Institute for Education
-
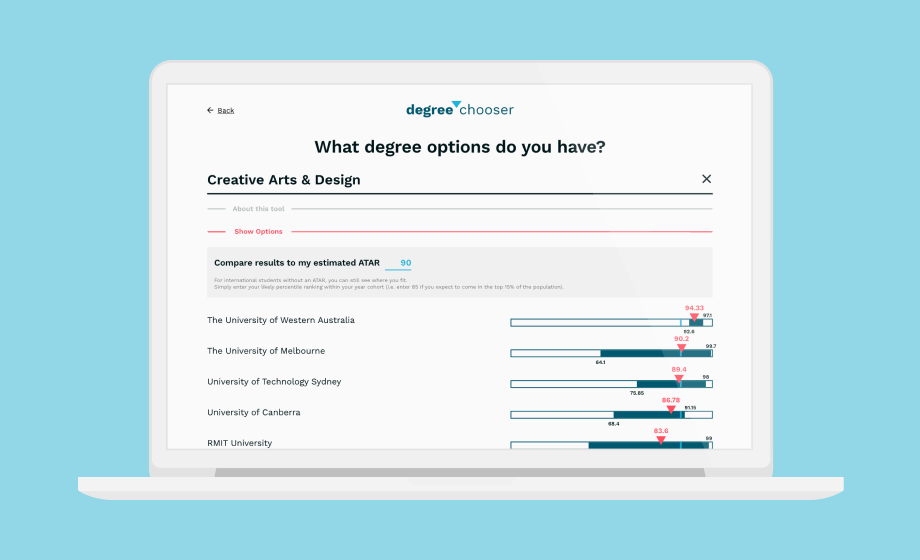
Degree Chooser
Barlow Advisory
-
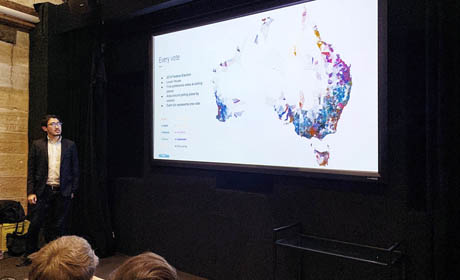
Jack Zhao at Data Visualisation Sydney
Article
-
Data visualisation conferences in 2019 and 2020
Article