View All


Want to meet more people in the data visualisation field? Get inspired with some new ideas and the latest technologies? We’ve compiled a big list of data vis conferences here, from the well known to the obscure, from the artistic to the scientific, and from the new to the venerable. Have we missed any? Let us know! We’ll update this list as conference dates are announced.
Encode + Datafest
Partner event Tbilisi Datafest: November 14 2019, Tbilisi State University, Georgia
Encode 2020 TBC
encode.info
@encode_info
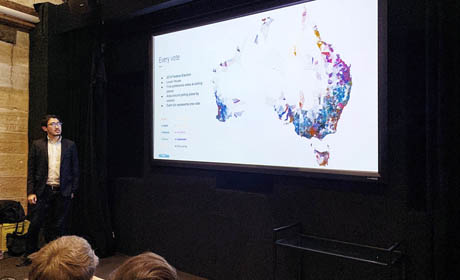
Encode is a new two day conference with a focus on data in journalism, information design and education. It’s part of the London Design Festival. Encode also has a partner event called Datafest, in Georgia: the “first international data event in the South Caucasus”!
From the website:
Bringing the creative community together to share and explore the future of data-driven stories. More than 30 practitioners, educators, and leaders in the field will engage, share and debate the way we read and interact with data.
Open Visualization Conference
ODSC West: October 26-30, 2020, San Francisco
ODSC East: April 13-17, 2020, Boston. VIRTUAL CONFERENCE due to COVID-19
ODSC Europe: September 14-18, 2020, Dublin
ODSC India: September 9-12, 2020, Bengaluru
@ODSC
The ODSC (Open Data Science Conference) has many chapters, from the east and west coasts of the US to Europe and India. They often have a specific data visualisation track, the “Open Visualization Conference”. The larger Open Data Science Conference itself is just that, “Bringing together the global data science community to help foster the exchange of innovative ideas and encourage the growth of open source software.”
From the website:
The Open Data Visualization Conference brings together the world’s most creative minds that are changing the way we visualize, understand, and interact with data. Join a community of designers, data scientists, and developers to learn the art of storytelling, information communication, and data visualization, using the latest open source tools and techniques. We offer multiple talks, workshops, and interactive presentations to help you understand and create beautiful, insightful, and actionable data graphics and visuals.
DataViz Live
February 25-26, 2020, London
tucana-global.com/datavizlive
@DataVizLive
DataViz Live is a new conference with an impressive lineup of speakers, including Andy Kirk, David McCandless and Cole Nussbaumer. There seems to be a focus on visualisation in a business context (dashboards, Business Intelligence and analytics get a few mentions), but they also cover media and more general data visualisation topics.
IVAPP
February 27-29, 2020, Valetta, Malta
February 8-10, 2021, Vienna, Austria
ivapp.visigrapp.org (2020 conference)
2021 conference
IVAPP, the “International Conference on Information Visualization Theory and Applications”, is focused on the computational side of visualisation, covering areas from “Hardware-Assisted Visualisation” to “Mathematical Foundations of Interactive Visual Analysis”. It also includes some higher-level topics though, such as data driven storytelling. It’s part of VISIGRAPP, the 11th international International Joint Conference on Computer Vision, Imaging and Computer Graphics Theory and Applications. That’s a lot of acronyms, but hey it’s in Malta!
From the website:
The International Conference on Information Visualisation Theory and Applications aims at becoming a major point of contact between researchers, engineers and practitioners in Information Visualisation. The conference will be structured along several topics mainly associated with Information Visualisation, but also with related fields such as Visual Analytics or Scientific Visualisation.
Data Festival
March festival POSTPONED due to coronavirus.
New dates: September 14-16, 2020, Munich Germany
datafestival.de/en
@data_festival
This is a festival of all things data, but includes data visualisation. Areas of discussion cover “Data Science & Machine Learning, Data Engineering & Architecture, Data Visualisation & Analytics, Fast Data, Infrastructure & Databases as well as Agile Development, Blockchain, Data Ethics and Data Privacy”.
From the website:
Share your passion for #data. The conference brings together the community of users and data experts, including data scientists, data engineers, AI and machine learning experts, analysts, BI professionals, software developers, software architects, scientists, researchers and many more.” The “Data Visualisation & Analytics” section includes “Information Design, Geo-/Spatial Analytics, Graph Analytics, Big Data Analytics, Data Discovery, Storytelling and IoT Analytics.
Malofiej
Pamplona, Spain
March conference and workshop CANCELLED due to coronavirus. The awarding of prizes will still take place and will be announced in June.
malofiejgraphics.com
@malofiej
Referred to as the “Pulitzers for infographics”, Malofiej is hosted at the University of Navarra in Pamplona, Spain and organised by SND (the Society for News Design). It’s a visual journalism focused conference that brings together media professionals, academics and data visualisation specialists.
<a href="https://graphichuntersshow.nl/" target="_blank">
S-H-O-W
Utrecht, the Netherlands
April conference CANCELLED due to coronavirus, new dates to be announced soon.
graphichuntersshow.nl
@GraphicHunters
The S-H-O-W conference is organised by Graphic Hunters, a data visualisation training institute in Utrecht, the Netherlands. It’s a two day event, an afternoon of talks followed by a day of hands-on and interactive workshops. The entire conference is in English.
From the website:
Data is numbers, facts, true, bold. When we communicate data to an audience in a visual way, we need to add an emotional layer of design to convince the audience, to guide them, to attract them, to make them click. How can design choices help to add emotion to raw data? How do we bring the story across? How can we feel the numbers?
Visualizing Knowledge
Helsinki
May conference CANCELLED due to coronavirus. More information to come.
vizknowledge.aalto.fi
@vizknowledge
This conference is run every year in Helsinki, Finland. It’s now organised by Aalto University, by staff and students in the department of Visual Communication and Information Design. The 2020 conference is themed around “Visualizing Democracy”, including open data, election visualisations, democratic journalism and government reporting.
From the website:
Visualizing Knowledge brings together a diverse group of practitioners to discuss data visualization from multiple perspectives. This year’s event is centered around the symbiosis between natural sciences, information design and visual narratives with the key concept of senses – from human senses to machine sensors.
EuroVis
Event registration currently SUSPENDED due to coronavirus. More details to come.
May 25-29, 2020, Norrköping, Sweden eurovis.org Eurovis 2020 @eurovis2019
EuroVis is a visualisation conference organised every year by the Eurographics Working Group on Data Visualisation, supported by the IEEE Visualisation and Graphics Technical Committee. No connection to the pop event.
From the website:
The exciting and vibrant field of visualisation is an increasingly important research area due to its wide range of applications in many disciplines. In general, our ability to collect, store, and archive data vastly exceeds our ability to derive useful knowledge and insight from it. This is a ubiquitous problem. Data visualisation is key to gaining an understanding of large, complex data sets by exploiting the human visual system.
VIZBI - Visualising Biological Data
May 27-30, 2020, University of Southern California, Los Angeles.
vizbi.org
@vizbi
VIZBI has been held every year since 2010, and tends to alternate between Heidelberg and the USA (although in 2017 it was held in Sydney). The 2020 conference will be held in LA.
From the website:
VIZBI features talks from “world-leading researchers who will showcase visualisations transforming how life scientists view data, and driving key advances in molecular biology, systems biology, biomedical science, and ecology.
VIZBI 2020 will feature talks on visual analysis methods; but there will also be a special focus on visual communication. VIZBI 2020 aims to go beyond ‘art & biology’, allowing participants to engage with the many cinematic and visual arts industries based in Los Angeles.”
Eyeo Festival
June 8-11, 2020, Minneapolis
eyeofestival.com
@eyeofestival
Billed as a “gathering for the creative technology community” the Eyeo Festival is pitched at the intersection of data, art and code. Speakers cover topics from data visualisation to creative coding, machine learning and cultural and ethical issues.
From the website:
The Eyeo Festival brings together a rich intersection of people doing fascinating things with technology. Artists, data designers, creative coders, AI explorers, storytellers, researchers, technology & platform developers all cross paths and share inspiration at Eyeo.
Tableau Conference
June 29 - July 1 2020, London October 5-8, 2020, Las Vegas tc19.tableau.com/ @tableau
Tableau is one of the best known conferences based around a tool that has become industry standard. There’s a big community around Tableau and it’s a huge conference, so by all reports it’s a great way to learn the latest Tableau features and meet people at the same time.
From their site:
At Tableau Conference we unite behind the mission to help people see and understand data. For four days, over 20,000 people from all industries and organisation sizes immerse themselves in a data-driven culture that is unparalleled in the industry. Come to ramp your skills faster with expert-led sessions. Leave with renewed motivation from inspirational keynote speakers and product innovation announcements. Connect to the biggest data community that will embrace you like a warm hug.
EVA London
July 6 – 9, 2020, London
eva-london.org
@EVAlondonConf
EVA (Electronic Visualisation and the Arts) seems to have a bent towards general digital art and digital humanities work, but some data visualisation inevitably creeps in.
From the website:
EVA London’s focus is on the development and application of visualisation technologies to various domains, including art, music, dance, theatre and the sciences. Held annually in July, EVA London is one of the international Electronic Visualisation & the Arts conferences. The first EVA conference was held in 1990, with the intention to create a space for people using or interested in the new technologies to share their experiences and network in a friendly, collaborative atmosphere.
DSSV2020 (Data Science, Statistics and Visualisation)
July 29 - 31, 2020, Duke University, North Carolina USA iasc-isi.org/events @iasc_isi
This is a satellite event of the 63rd World Statistics Conference, so the focus seems to be mathematical and scientific.
From the website:
The conference welcomes contributions to practical aspects of data science, statistics and visualisation, and in particular those which are linking and integrating these subject areas. Presentations should thus be oriented towards a very wide scientific audience, and can cover topics such as machine learning and statistical learning, the visualisation and verbalisation of data, big data infrastructures and analytics, interactive learning, advanced computing, and other important themes.
<a href="http://www.informationplusconference.com/" target="_blank">
Information+
September 24-27 2020, Georgia Tech, Atlanta USA
(Currently planned to go ahead despite coronavirus)
informationplusconference.com
@infoplusconf
This biennial conference started in 2016 in Vancouver, Canada and moved to Potsdam, Germany for 2018. In 2020 it will be hosted at Georgia Tech in Atlanta by Yanni Loukissas. It’s an interdisciplinary conference that doesn’t skimp on the critical theory behind information design and visualisation.
From their site:
Information+ 2020 is planned to take place. We are closely monitoring the development of COVID-19. At the moment conference preparation is proceeding under the assumption that the virus will be stopped before Fall.
The conference brings together researchers and practitioners in information design and visualisation to discuss common questions and challenges in these rapidly changing fields. Unlike discipline-specific gatherings, Information+ seeks to foster productive exchanges amongst the variety of people involved in the theories, practices, and pedagogies of analysing and communicating information.
IEEE VIS
October 26-30, 2020 in Salt Lake City, USA
ieeevis.org
@ieeevis
A week-long conference organised by IEEE, this large, prestigious and venerable conference goes back all the way to 1990. The VIS conference is where you’ll find cutting edge research and innovations in data visualisation long before they reach the mainstream commercial world.
From their site:
The year’s premier forum for advances in theory, methods, and applications of visualisation and visual analytics. The conference will convene an international community of researchers and practitioners from universities, government, and industry to exchange recent findings on the design and use of visualisation tools.
24th International Conference Information Visualisation
28 - 31 July, 2020, Vienna, Austria
24 - 27 November, 2020, Melbourne Australia
iv.csites.fct.unl.pt
@IVconf
Covers many areas of visualisation, from art and design to biomedical visualisation and visualisation in the built environment.
From the site:
The objective of the symposium is to bring together researchers and developers from academia and industry working in all areas of visualisation, with a special focus on science, engineering, art and applications of visualisation.
OpenVis
2020, TBD (probably in Boston)
openvisconf.com
@OpenVisConf
OpenVis is a two day conference based around open source data vis tools. It’s been running since 2013 in Boston, though the 2018 conference was held in Paris. It will probably be back in Boston in 2020.
From the website:
Our conference program merges the latest in visualisation research, technology, and practice, constructed by an open-call submission and committee review process. In 2018, we followed the main program by a third day of educational, hands-on workshops.
Infographics Conference
October 11, 2019, Gooiland in Hilversum, the Netherlands
2020 TBC
infographicscongres.eu
@InfographicsNL
The Infographics Conference covers both data visualisation and infographics, and attracts some great speakers. Each annual conference is based around a loose theme, such as “Facts + Beauty = Truth” (2016), or “Infographic Myths” (2017).
What they say:
An inspiring day full of #infographics, #dataviz and everything else in visual #storytelling
<a href="https://op.europa.eu/en/web/eudataviz/home" target=“blank”>
EU DataViz 2020
2020, TBD
op.europa.eu/en/web/eudataviz/home
@EU_opendata
EU DataViz is organised by the European Union’s publications office. The last conference was held in Luxembourg in November 2019, but it’s likely to take place again in 2020 (tbc). Watch this space, and follow the EU Open Data Twitter account!
They’ve gone for the slightly unconventional method of putting 8 hours of 2019 conference recordings in a single YouTube video - but you can navigate to different timestamps within the video via their website, for example Caroline Goulard from French datavis agency @dataveyes is here.