The Asian Century
According to 2016 census data, 28.5% of Australia's population was born overseas, or 6.9 million people. Of this figure, 13.17% stated that they arrived on or before 2000, and 12.26% since 2000 (3.06% didn't specify). The latest figures show this number has risen to 29% - or 7.3 million people.
The origin of migrants has dramatically changed since the year 2000. Asian-born migrants (mainly from China and India) have overtaken the once dominant Europeans (mainly from the British Isles).
The East Coast Capital Cities and Perth
A higher income means more choices. Coastal areas, city centres, and leafy suburbs seem to be universally preferred by wealthy migrants (those with a personal weekly income of $3,000 or more).
More recent arrivals seem to prefer central locations, while the older migrants are spread more evenly between inner city and suburbia.
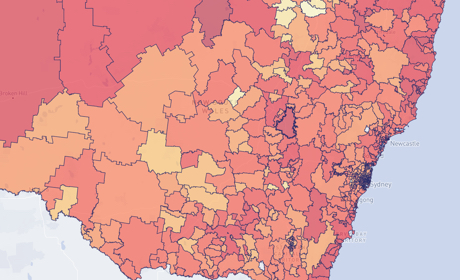
These maps show the concentration of people:
- Arriving on and before year 2000 (since 1900)
- Arriving after 2000 (until 2016)
- Mix of pre-2000 and post-2000 arrivals
Sydney
Melbourne
Brisbane
Perth
Adelaide, Canberra, Hobart, and Darwin
The smaller number of migrants (and lower overall population) in these four cities did not allow us to paint a clear picture of settlement patterns. However, the maps of these smaller cities do help us visualise the stark contrast with the more populated metropolises where most migrants choose to live.
Adelaide

Canberra

Hobart

Darwin

 View All


