 View All
Multi-Omics Visualiser


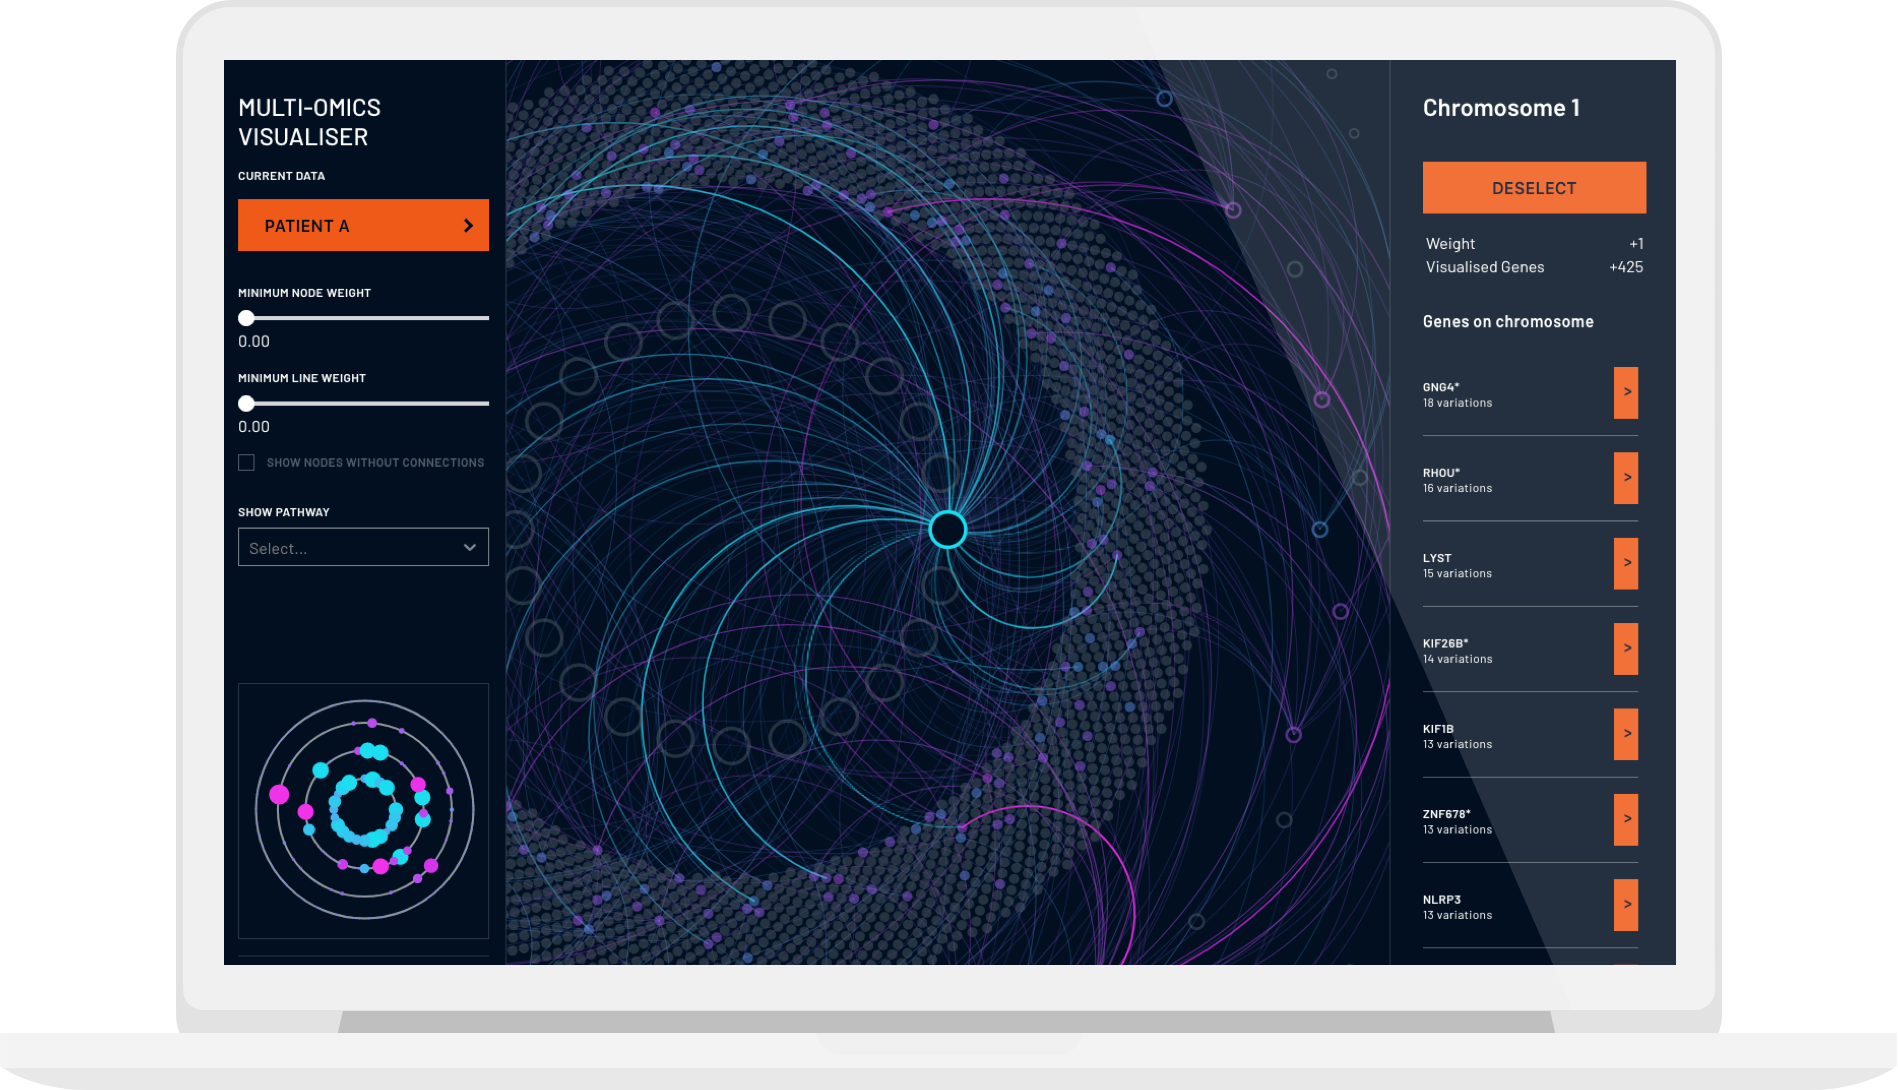
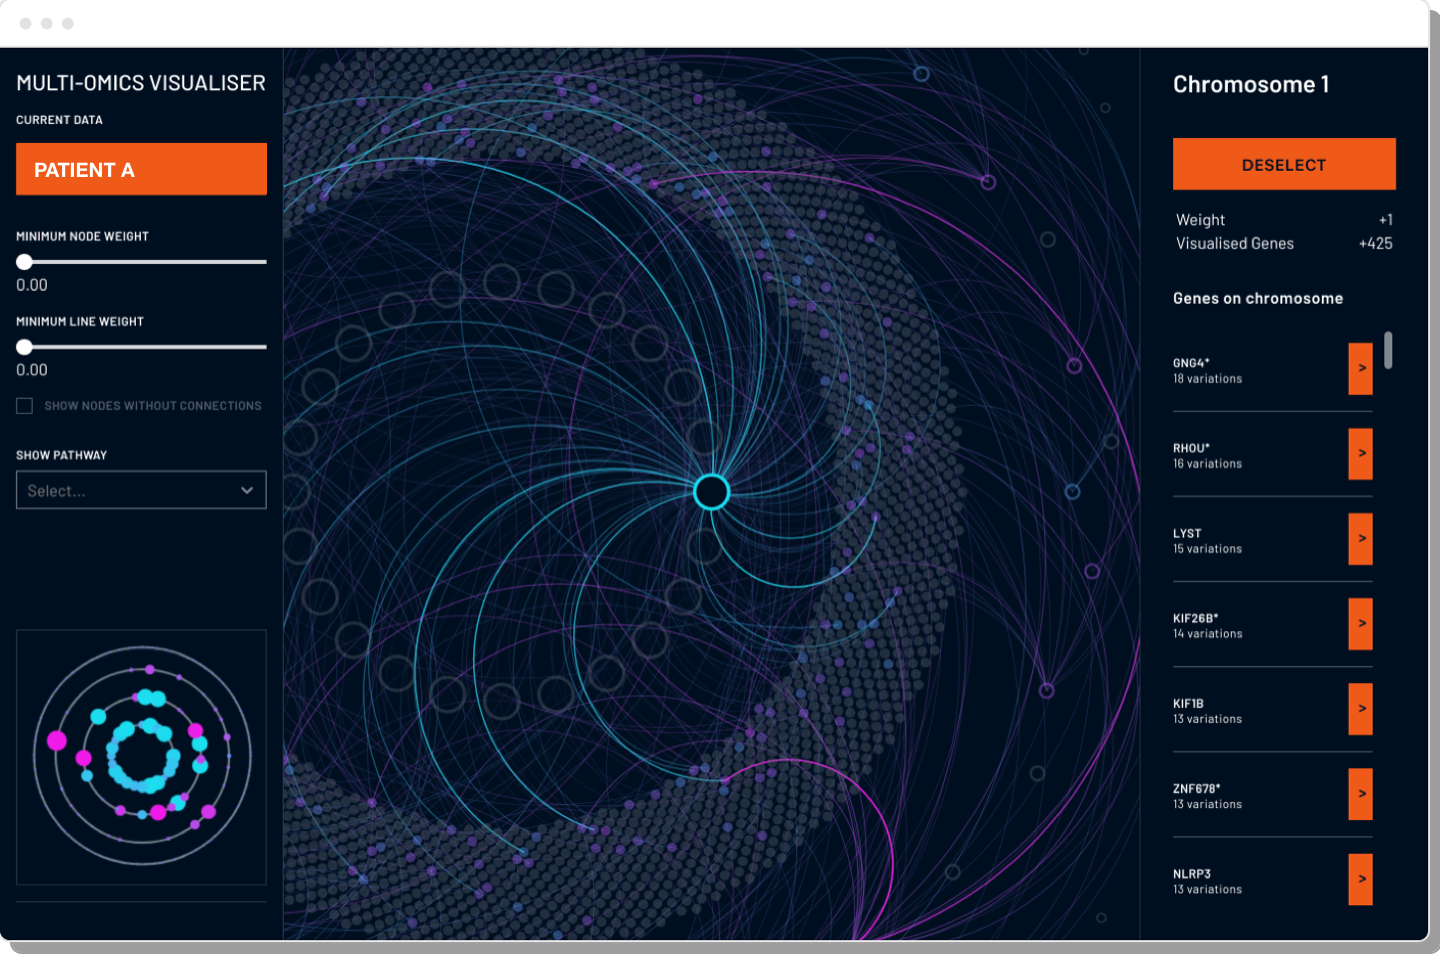
Together with Iggy Get Out, we developed a cutting-edge visualisation tool for multi-omics datasets that helps provide immediate and actionable insights to clinicians and patients. The new web-based tool integrates multiple omics datasets for each patient, enabling scientists and clinicians to seamlessly visualise the interactive datasets and compare large amounts of genomic information. The software was developed in a collaboration between researchers, data scientists, designers and developers.
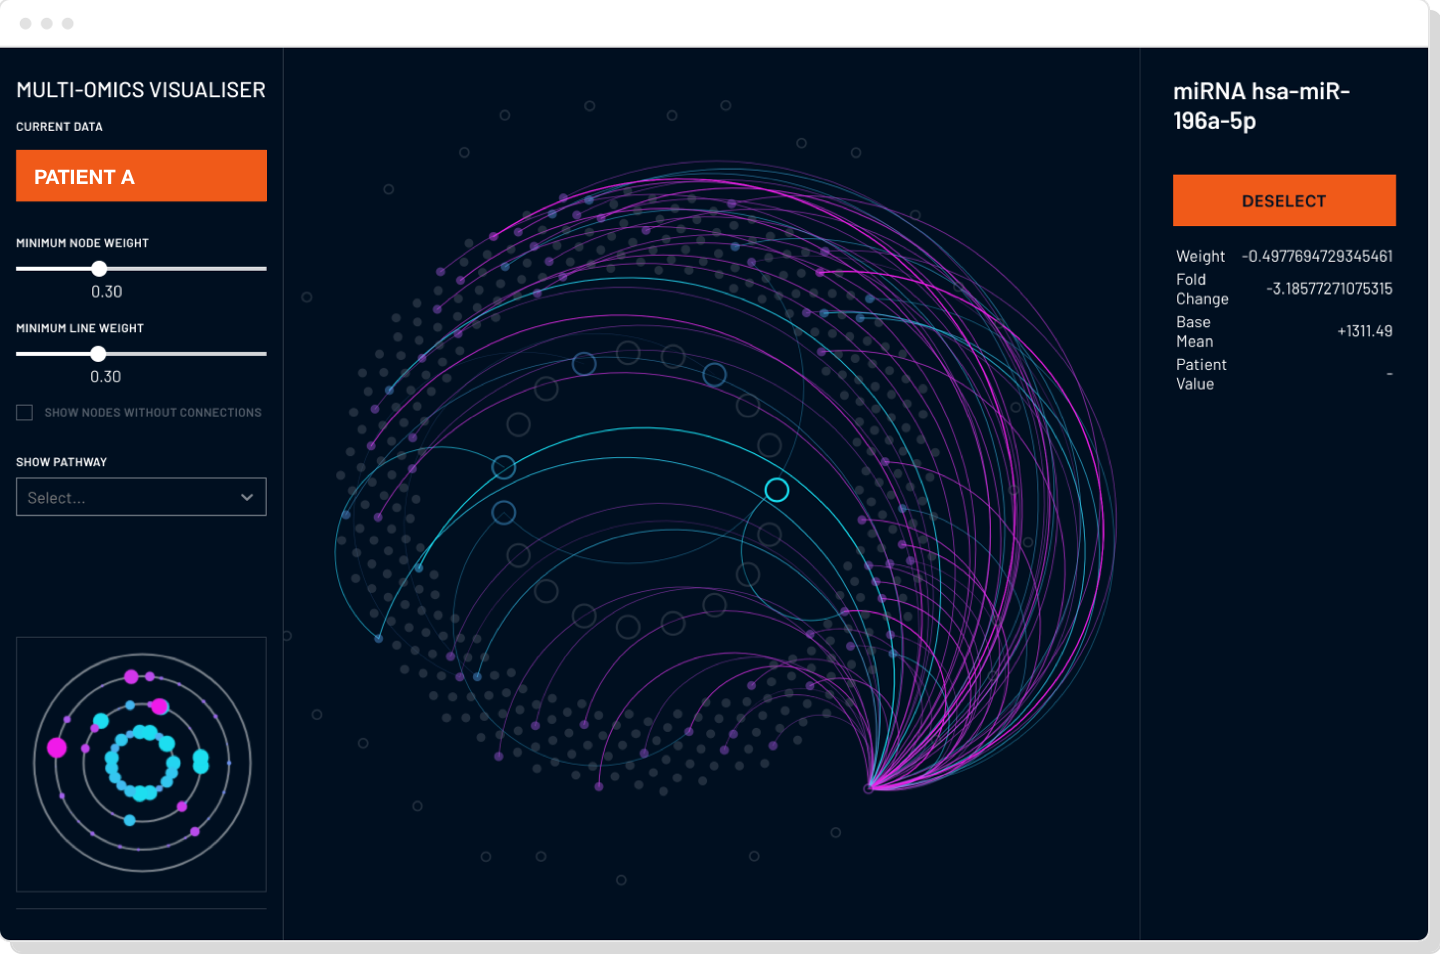
Debilitating motor neurone diseases, such as amyotrophic lateral sclerosis (ALS) are inherited in 5 to 10 percent of cases, while the rest have no known cause. We created a visual analytical tool for geneticists to find the hidden pathways that are causing the disease in each patient. This tool is fast tracking the discovery of targeted diagnostics and therapeutics.
Our adaptation of an interactive map-like interface for filtering and inspecting data provides two advantages. Firstly, it gives an investigator the ability to seamless transit between a system-level macro view and an entity-level micro view, so the tool becomes an extension of the investigator’s thought process. Secondly, the simultaneity and the continuity preserves context throughout the session, this promotes efficiency and reduces error.
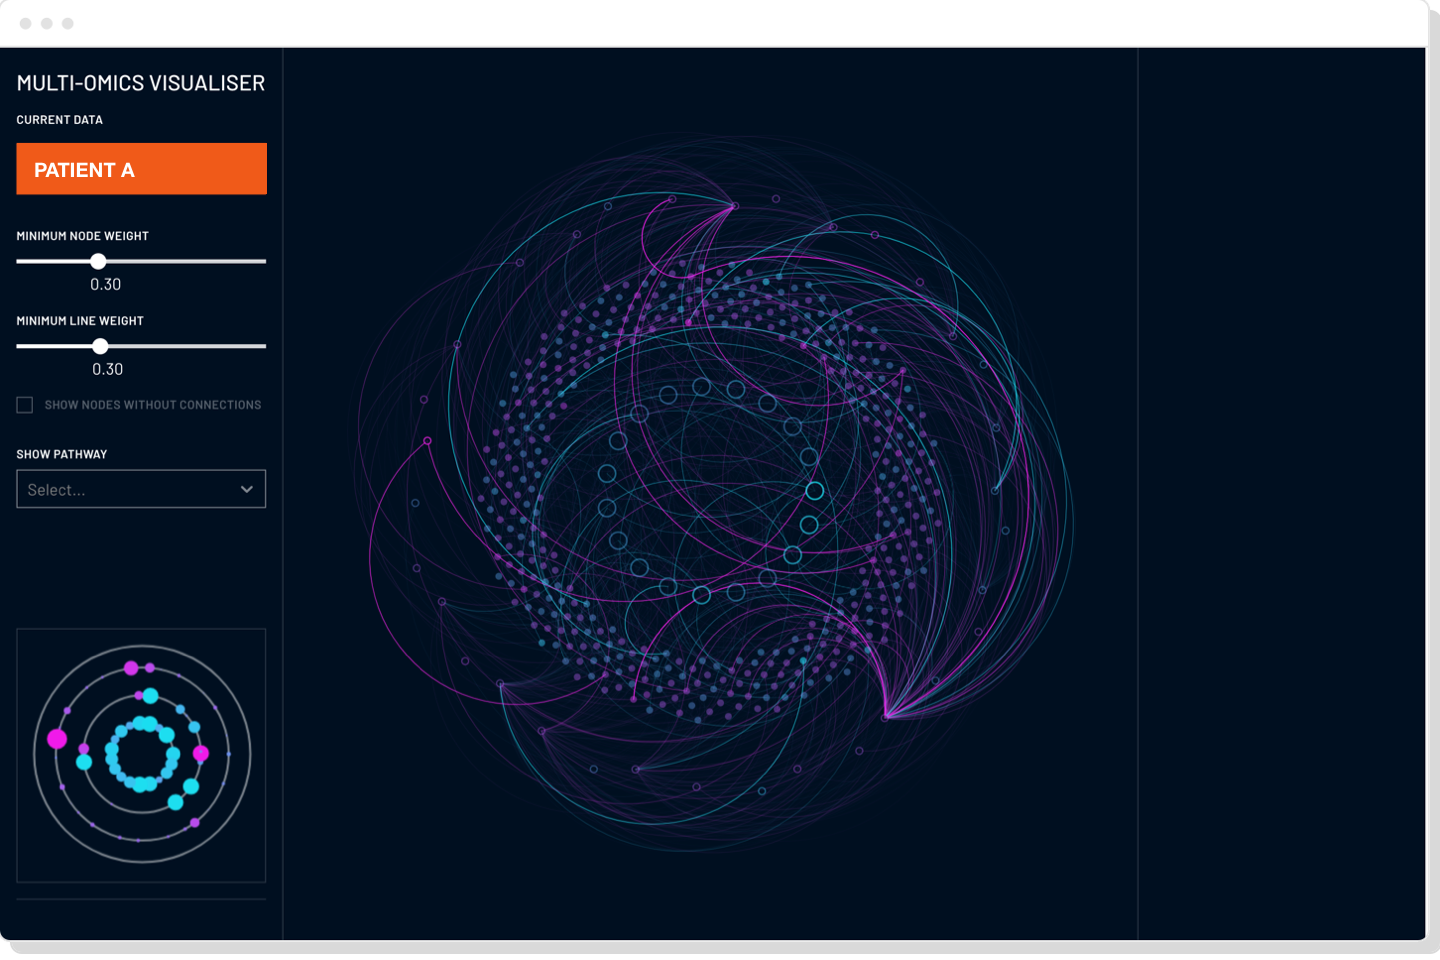
The patient/disease expression profile fingerprint is a unique way to enable visual comparison of different omic factors that could indicate disease markers within patients’ expression profiles. This could potentially also pave the way for machine-learning driven visual analysis of visualisation data
Related projects and articles
-
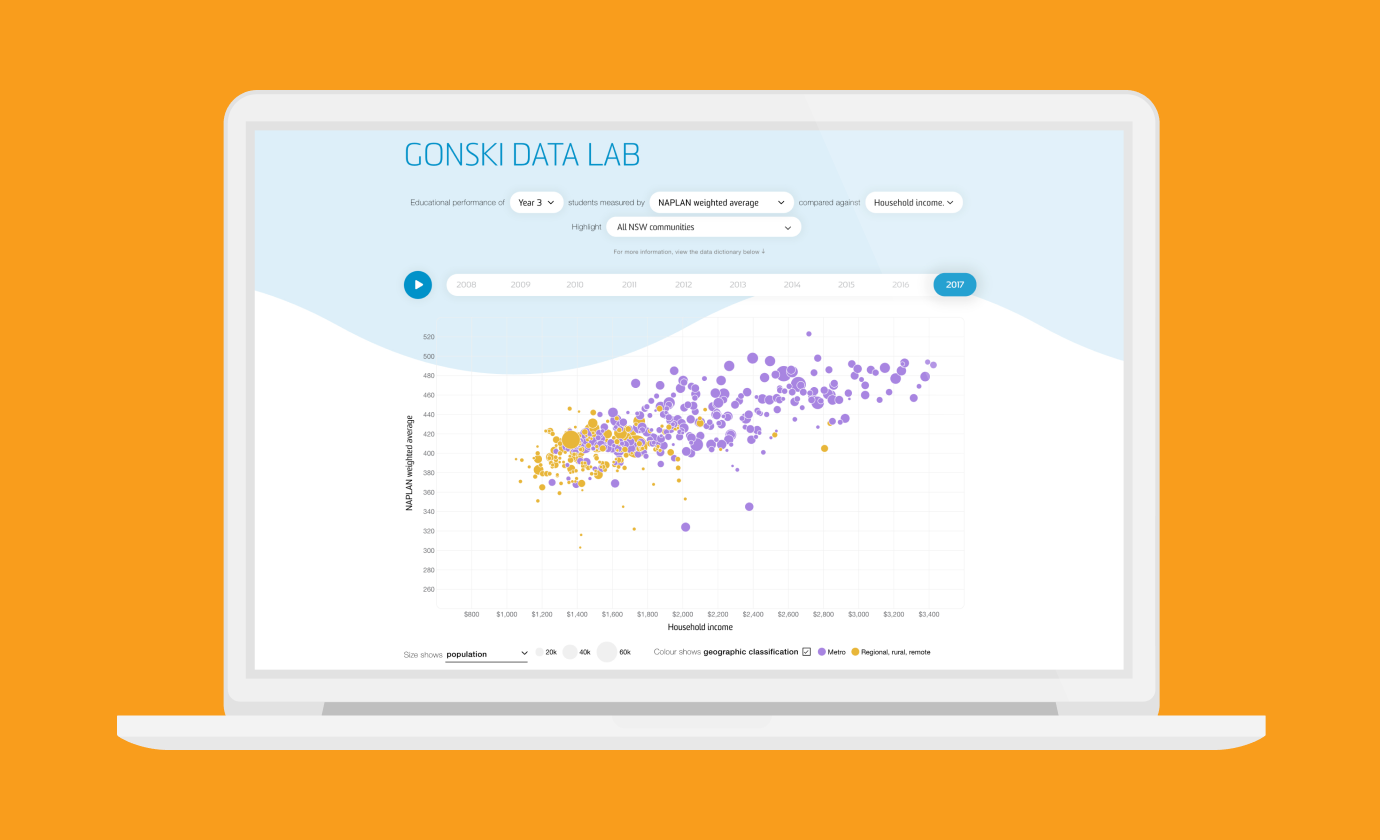
Revealing the social factors behind school performance
Gonski Institute for Education
-
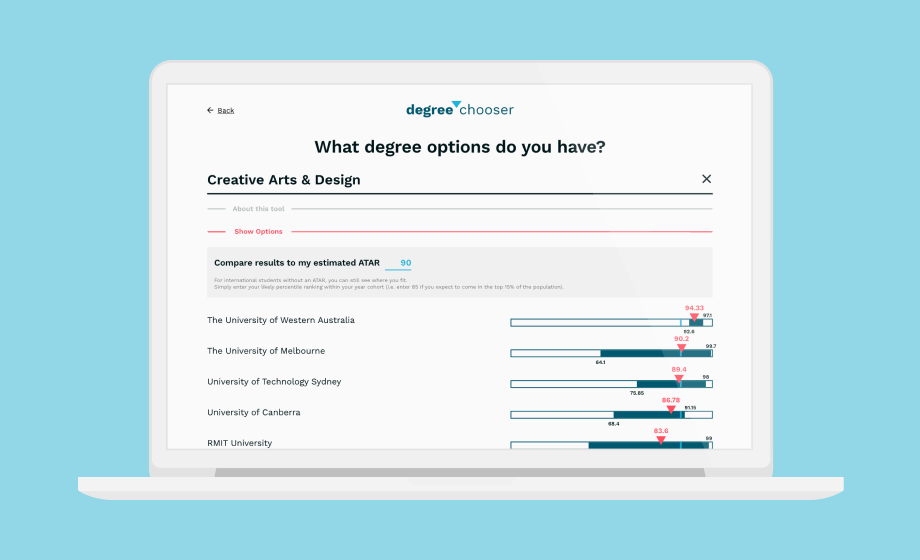
Degree Chooser
Barlow Advisory
-
Using dot density maps to visualise complex population data
Article
-

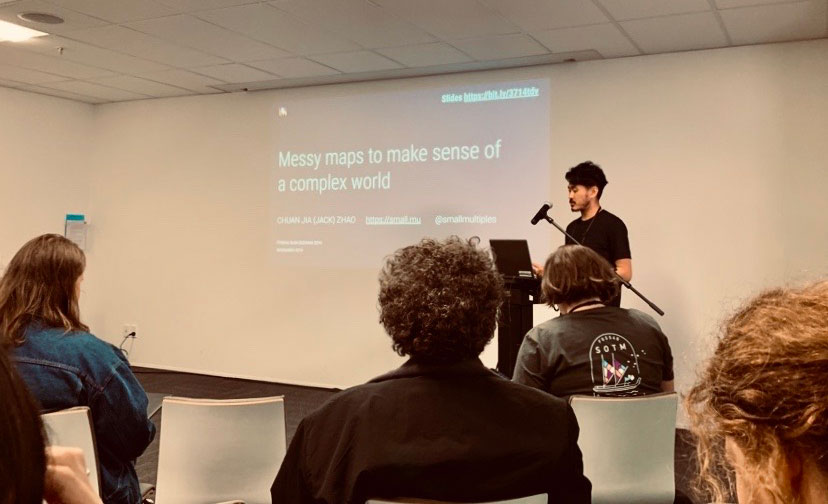
Making Data Delicious: Sydney Design Festival Talk
Article