View All


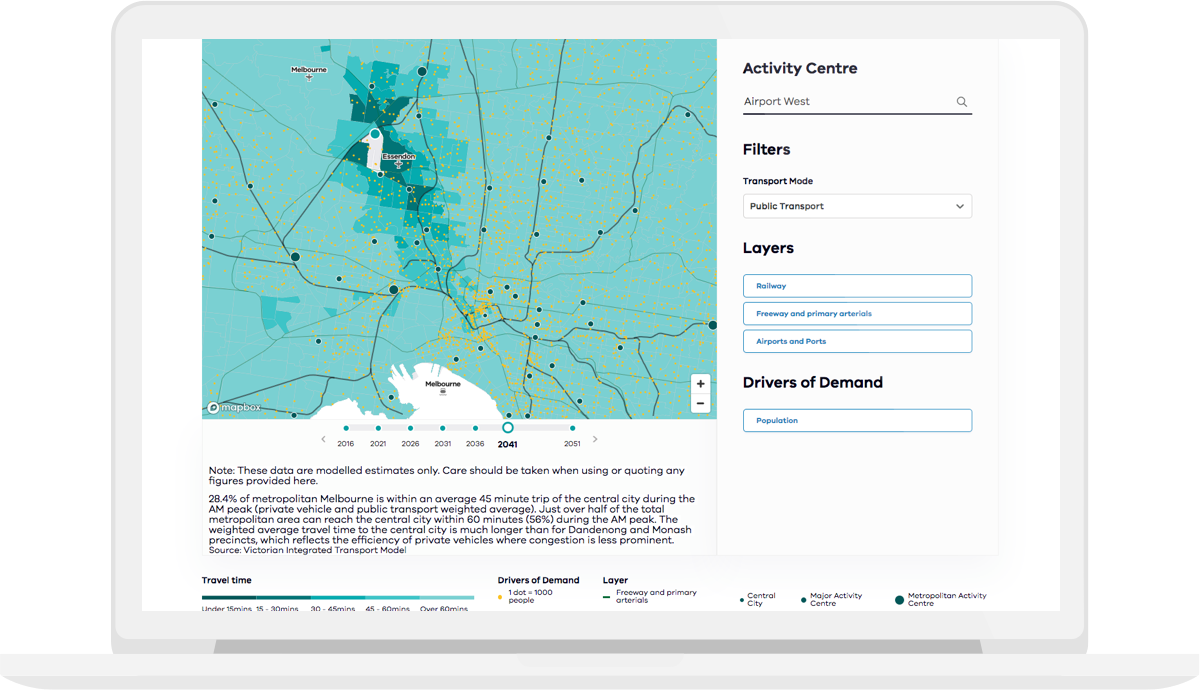
Lately I’ve been working on a big project for Transport for Victoria. It was a huge dashboard with over 10 different maps, each based on a large dataset that needs to be updated from a data management system.
Unfortunately it’s not a public project, but if you’re curious, you can check out our projects page and read about it. Essentially, this project was too large to render whole maps at once on the client side. The JSON payloads would just be too huge.
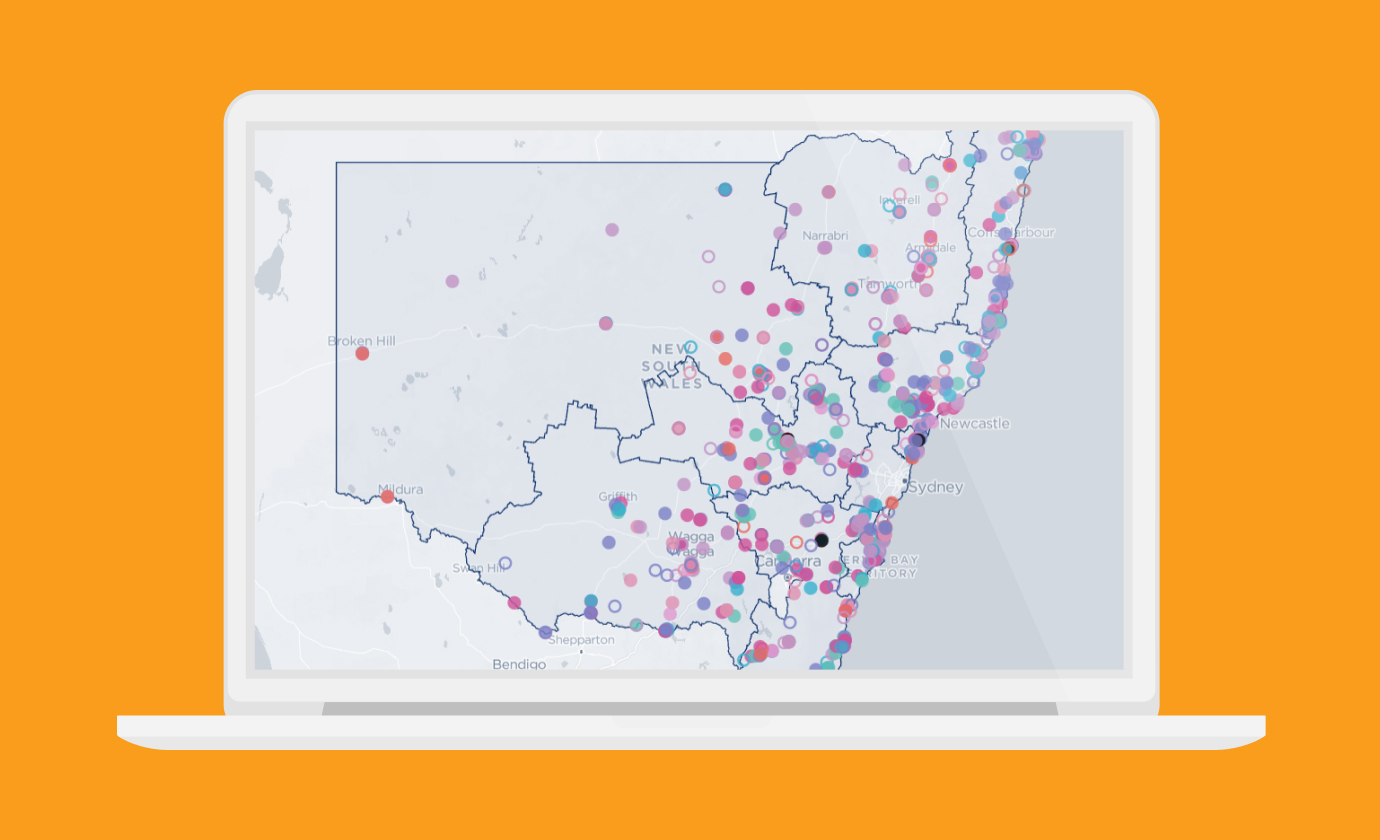
We had a similar problem with a smaller but similarly data-heavy project, our Every Vote map that was published in the Guardian. With one dot for every 16 million votes in Australia, that’s a lot of JSON data!
So, what to do?
Technically at least, this is a solved problem. The answer is a tile server. You’ve probably seen an online map loading, and you’ll notice that it loads one square at a time. These are tiles, and a tile server is the server that serves these images. If you can load tiles one by one, you don’t need to send the whole map to the client at once.
There are online services that run tile servers as part of their offering (one example is Carto), but they’re not very flexible and none of them are cheap. Luckily, it’s not that hard to set up a tile server for yourself - I gave a talk about building tile servers at the Sydney Node.js meetup recently. I’ll show you how!
Background
Before we jump in to building a tile server, an introduction to some general geospatial data formats and technology:
GeoJSON
GeoJSON is a specification for how to structure JSON for geospatial data. As JSON, this is very web friendly, and you can represent everything from points to LineStrings to MultiPolygons. Here’s an example:
There’s one big drawback of this format though - just like normal JSON, it’s a bit repetitive, so the file size can quickly become huge.
TopoJSON
TopoJSON is also a JSON specification, which tries to tackle the file size problem of GeoJSON. To achieve this, it reuses geometries. This is great for cutting down bytes on the wire, but it also means that it’s not as readable for us humans.
Another slightly annoying fact is that most map libraries don’t support TopoJSON, which means that usually the server will send TopoJSON and the first thing you do on the client is to convert it to GeoJSON.
Depending on the dataset you get large size savings though, so it’s definitely worthwhile.
Shapefiles
Shapefile is a very common data format as well. It’s not JSON-based, and definitely not as web friendly. Usually I’ll convert it to TopoJSON or GeoJSON.
Handy tools
Some handy tool for viewing and processing geospatial data:
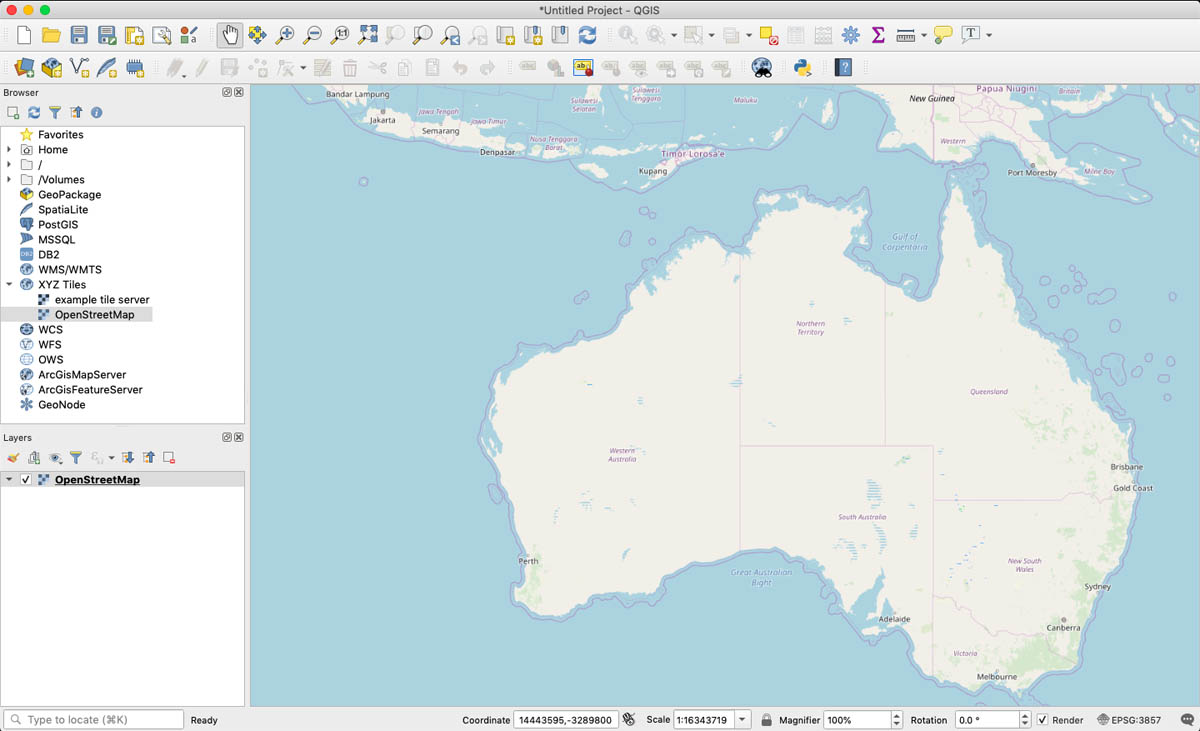
QGIS is an open source desktop application. It’s very powerful and can do most things, but it’s a bit overwhelming.
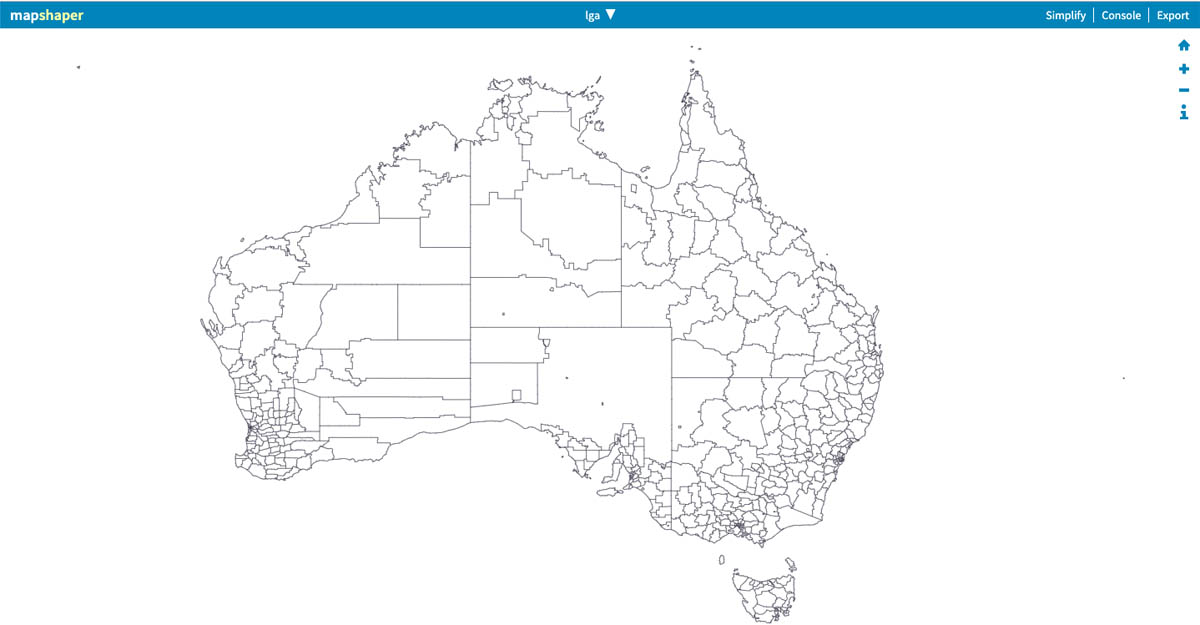
All these tools have different ways of simplifying geometric shapes, which can be great for displaying large geographical datasets in the browser. Sometimes, this kind of simplification will allow you to send a fairly complex map to the client in one go, so you don’t need a tile server at all.
Unfortunately there’s not one simplification algorithm that gets it perfect every time. Instead you have to play around with different algorithms and compare the results with the level of granularity and simplification you require.
Preprocessing
You should definitely preprocess your data, and remove geometries and properties that are not needed for your use case. One library that makes that very easy is turf.js. I won’t go into that in detail here, but you can read up about it.
Building a tile server
These are all useful tools, but in some cases they might not be enough for your requirements. You dataset might be too large for example, or you might need more flexibility. That’s where building a tile server comes in, so you can send data to the client bit by bit in the form of tiles. That way, they only get the data that’s currently in view on their screen.
So, what kind of format do these tiles come in?
Raster vs Vector tiles
There are two main types of tiles, raster tiles and vector tiles. As you probably know, raster images are essentially pixel-based data, while vector images are based on shapes, lines and fills. For the Transport for Victoria project I mentioned above we used vector tiles, and the ‘Every Vote’ map uses raster tiles.
Vector tiles are a little more fancy and definitely the hotter new technology. I prefer them because you get to style your tiles client-side, whereas raster tiles have to be styled on the tile server itself.
Vector tiles are normally faster, which is helped by the fact that in this case, the vectors can be sent as binary data. The tile server we’re going to create now is going to use the Mapbox Vector Tile (MVT) format, which encodes the vector data in binary protobuf form. MVT tiles are an open standard, released under a Creative Commons License.
Postgres with PostGIS extension
Most of you probably heard about PostgreSQL, it’s an open source and very popular SQL database. PostGIS is a PostgreSQL extension that gives postgres geospatial capabilities.
There’s a lot to say about PostGIS. It can do all the things which QGIS and ogr2ogr can do: simplifying, manipulating, querying and so on. This is an example from the PostGIS website:
As you can see it’s normal sql, but we get a few special functions. For example there’s ST_Contains above, which allows you to query whether one geometry is contained within another geometry (in other words, if “something is in a place”). PostGIS also comes with a ST_AsMVT function which gives us map tiles directly (MVT, again, being a Mapbox Vector Tile). E.g:
Very handy indeed! But even though this is very powerful, it often returns more data than we need. That’s we won’t be using this function directly, we’ll do it through a library called mapnik (more on this below).
Express server
I probably don’t have to explain Express to you, the important thing here is that we’ll use it to add routes to our Node app. We start off by creating one route with a few params: the x, y and z coordinates of the map view we want (in real life we need to cast these as floats, you can see the full code at the bottom of the article). These are the only numbers we need to decide the contents of a tile. The frontend map library will automatically make new requests with these numbers as you pan and zoom.
The route handler function itself is quite easy. We call a very convenient function that we’re going to make, called createVectorTile. We give it the SQL we want it to execute and the x,y,z coordinates. This will give us back a vector tile in a protobuf format and we just pass that along to the client.
Mapnik
This is an optimisation step, and depending on how much data you have it might be unnecessary or absolutely critical. Mapnik, (according to themselves) is a C++ library of “lightning-fast cartographic algorithms”, with a Node package.
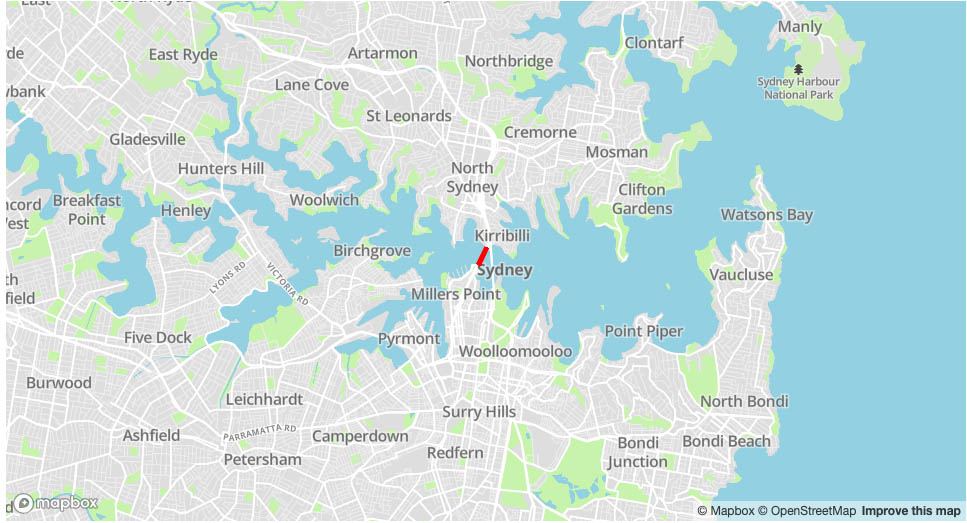
As an example, here we have a map with three lines.
createVectorTile
Next, we need to make the function that gives us the tiles (as a promise, in this case). I’ll walk through the code we need and then paste it in full at the end.
The first thing we do is require mapnik and install default plugins.
We call render to create the tile, and then getData to convert it to a buffer and return. I’ll put all this code together at the bottom of the post.
Caching
A nice aspect of using a normal express server is that we can leverage our existing knowledge of caching. We can add a cache header to the response and put all our tiles in redis. I recommend putting the generated tiles in redis, since querying geodata and generating tiles is quite hard work for the server.
That’s all I have for you! You can find the original slides from my talk here, or you can also see my “presenter version” with speaking notes (very similar content to this article).
I’ll happily try to answer questions if you have any. Feel free to add them as a comment below, find me on Twitter @bachstatter, or add an issue in the presentation’s GitHub repo (you can see the code that drives the presentation there too). Of course if you’d like me to make a map for you, you can always get in contact with Small Multiples.
Full code:
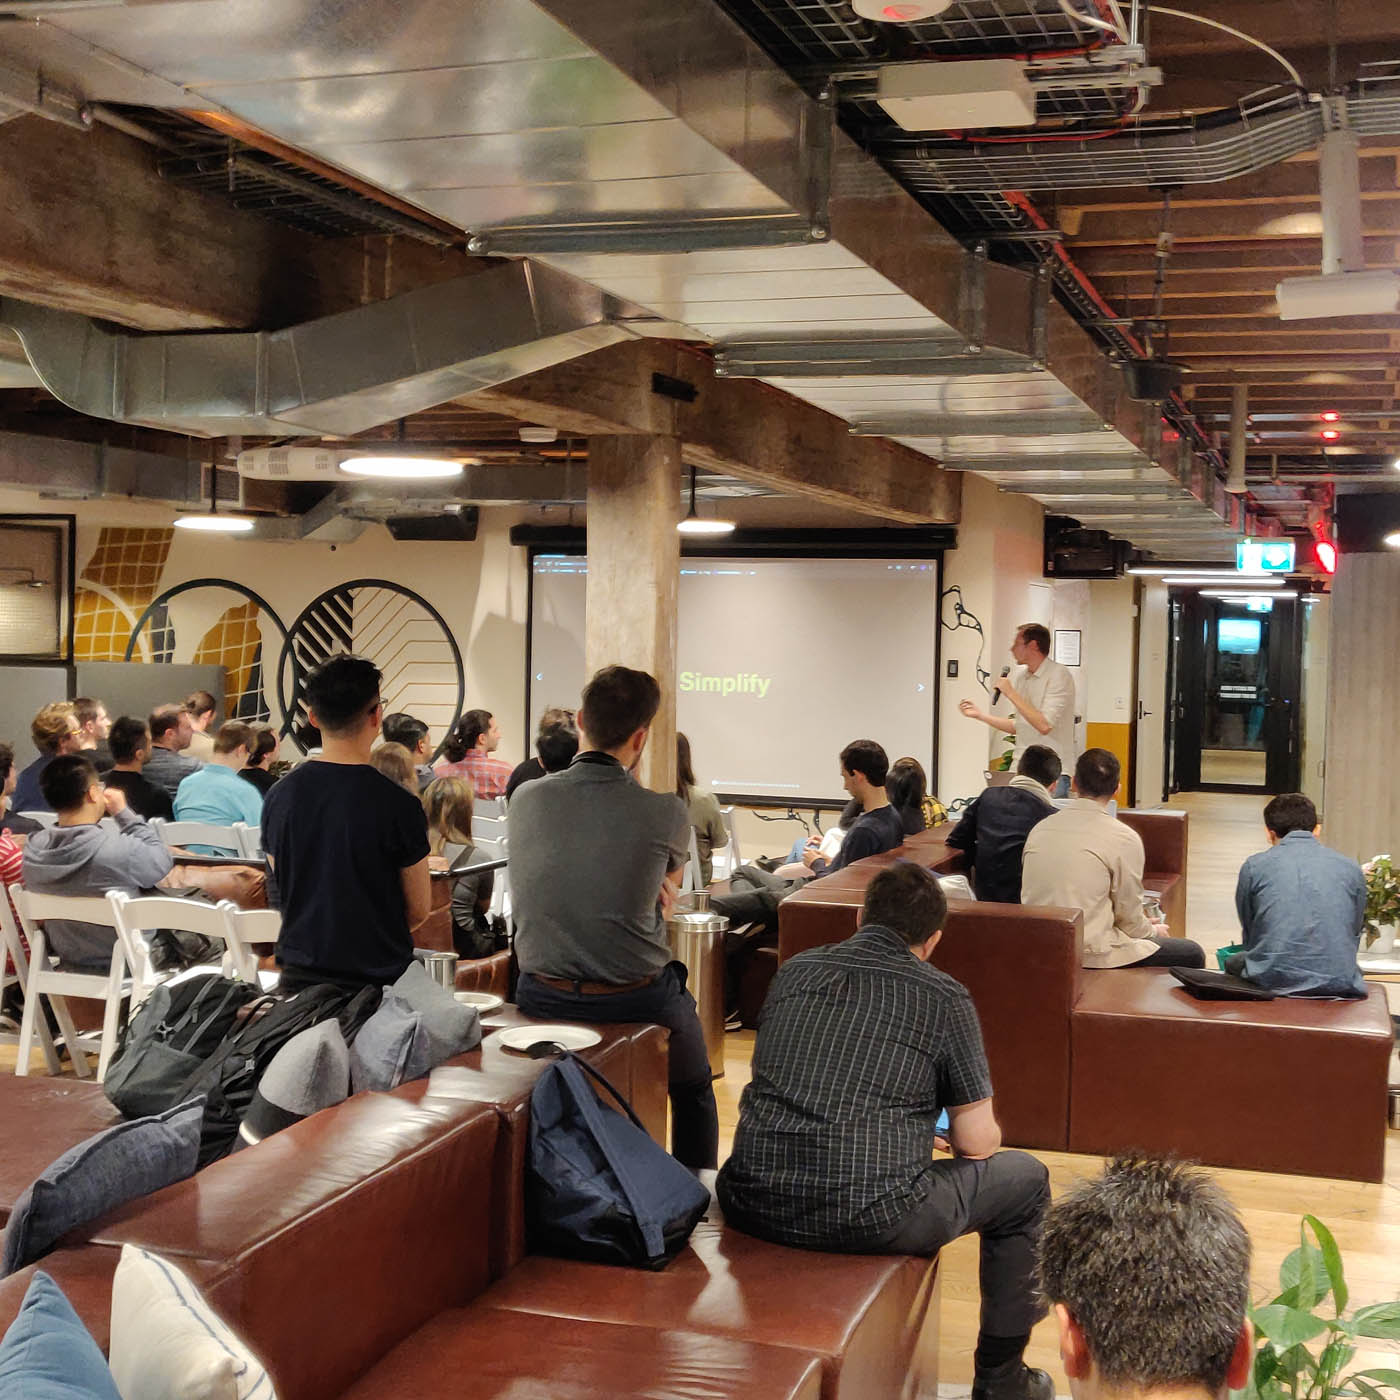
Giving a talk about tile servers at Node Sydney