 View All
Australian election results: one dot for every vote


The Problem
Broad brushstroke visualisations of “who won which seat” might tell you the results of the election, but they ignore a lot of interesting details. There are often little pockets and towns within each electorate where smaller parties such as the Greens, One Nation or Independents hold sway. They also miss crucial data points, for example the spread of voters - do the Liberal voters live in the north of a certain electorate, and the Labor voters to the south? Or do diverse views live alongside each other, with neighbours holding many different views in the one area?
.jpg)
Our solution
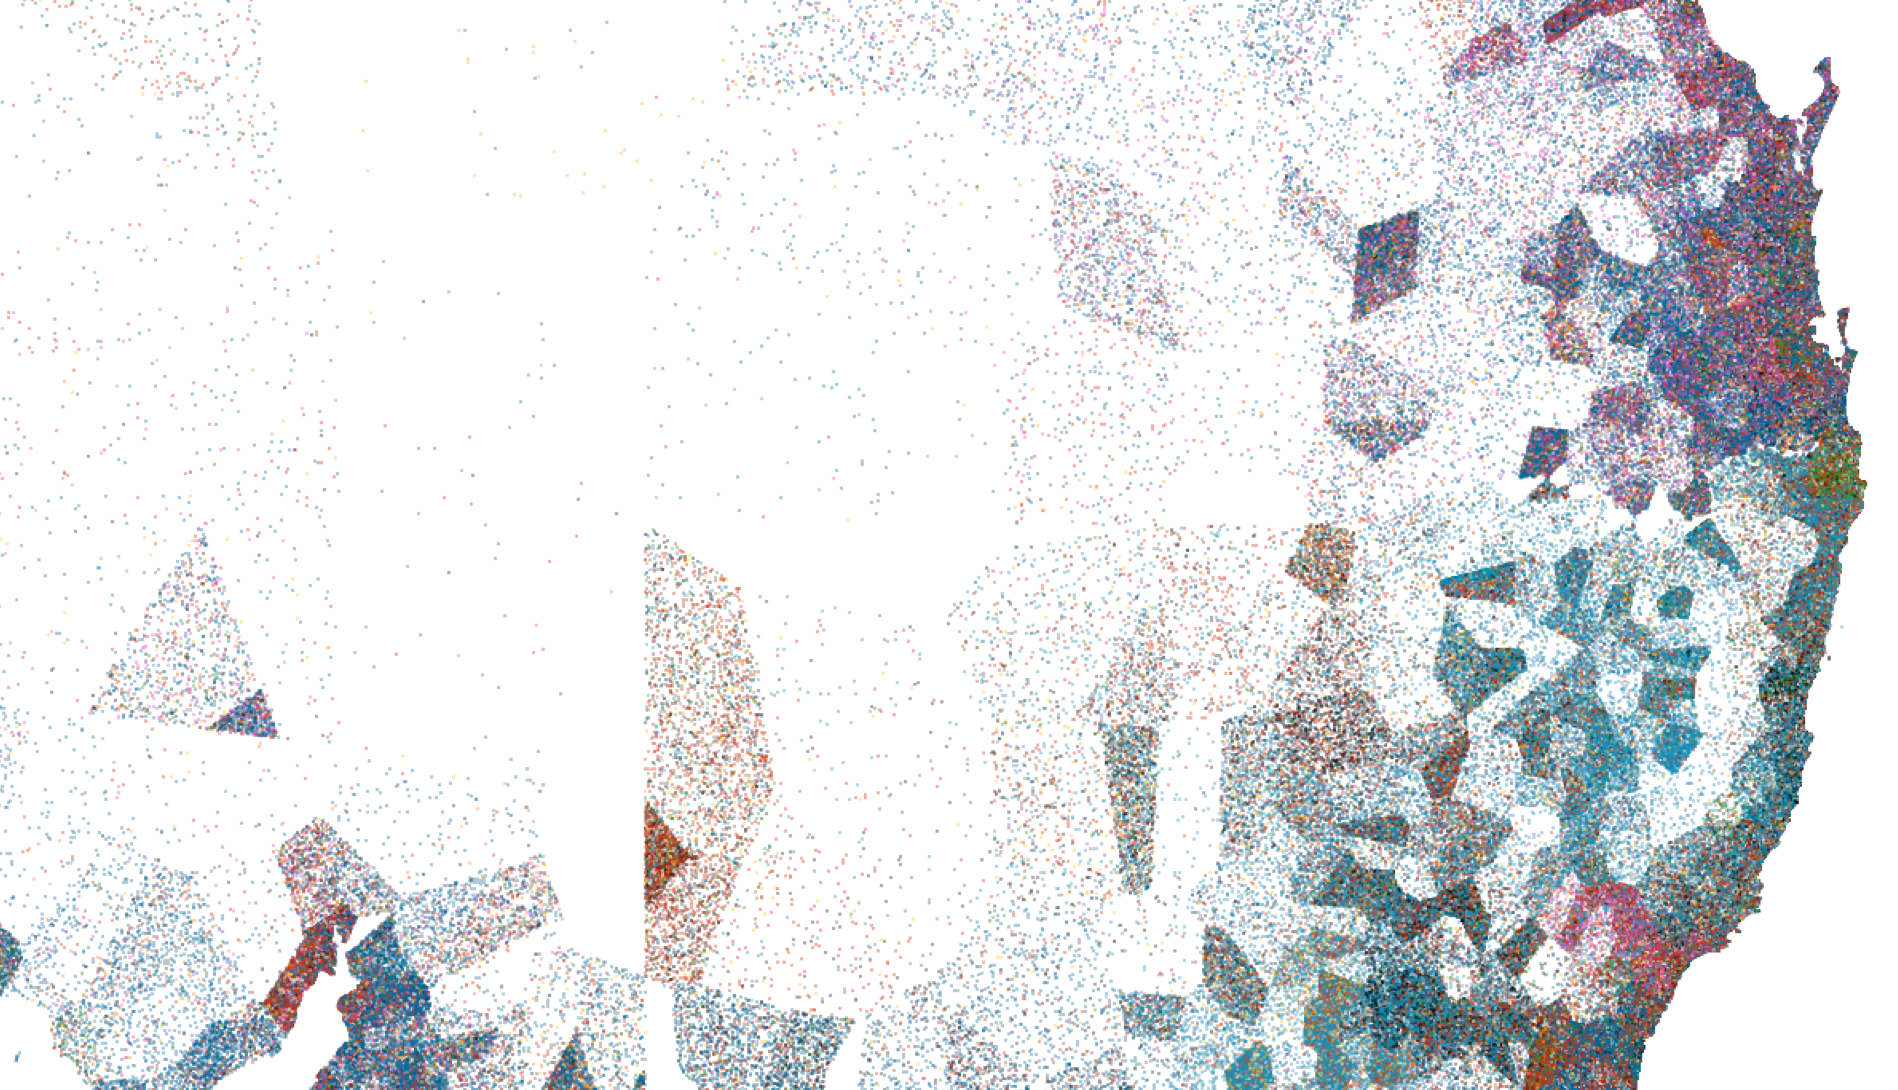
Rather than broad homogenous colour blocks for each electorate, Small Multiples' Jack Zhao went completely in the opposite direction. Every vote cast is displayed as a single dot. Rather than abstract blocks, we get something more like a pointillist painting, where dots of pure colour blend from a distance to give an overall impression from a distance. Votes are randomly placed within Voronoi areas, with each area centred on a single polling booth. In this way the map also gives a sense of population density, clearly showing the sparse, non-metropolitan regions against the more dense towns and cities.
Check out some more of our election based visualisations, such as State of Play for the Australian, or our interactive election scenario builder for the Australian Financial Review. Have some questions about map-based visualisations, or love making them? Get in contact.
Related projects and articles
-
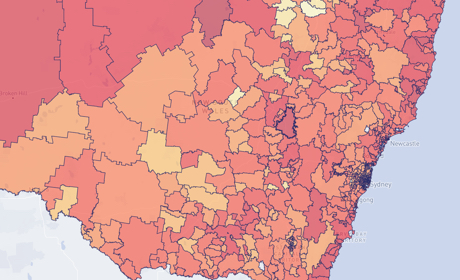
Occupational Risk due to COVID-19 in NSW
Article
-
Business empires in Australia
Article
-

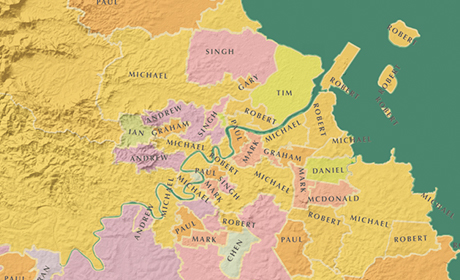
Hanzi Universe
Small Multiples
-

Census Data Explorer
SBS