 View All
Dynamic Dashboards for Data-Driven Policy Insights and Transparency


The Challenge
The project required keeping multiple dashboards updated and automating the process with minimal technical assistance. Additionally, the complexity of diverse geographic data, including Statistical Area 3s and 4s, Local Government Areas (LGAs), and SA2s.
The Solution
Over three years, our team achieved remarkable milestones by delivering over 10 visually consistent and technically robust dashboards. The Queensland Audit Office (QAO) embraced the new process, implementing a total of 22 updates, effectively supporting their reports to parliament. To maintain consistency and ease of maintenance, we developed a standardized data methodology and design approach for the dashboards. We actively increased the data visualisation capability of the QAO team, empowering them to create impactful visualisations independently. As a result, the implementation of our dashboards led to heightened engagement with reports to parliament, capturing the attention of decision-makers and stakeholders with clear and concise communication of complex information.
By utilising specialised geographic information systems (GIS) tools and libraries, we harmonized and standardized the geographical data, allowing users to explore insights across different administrative boundaries effortlessly. Interactive features such as filters and drill-down functionalities empowered clients to dynamically interact with the data, gaining valuable insights from both macro and micro perspectives.

Overview and metrics breakdown
The Dashboards
- Explore entities' progress in implementing our recommendations
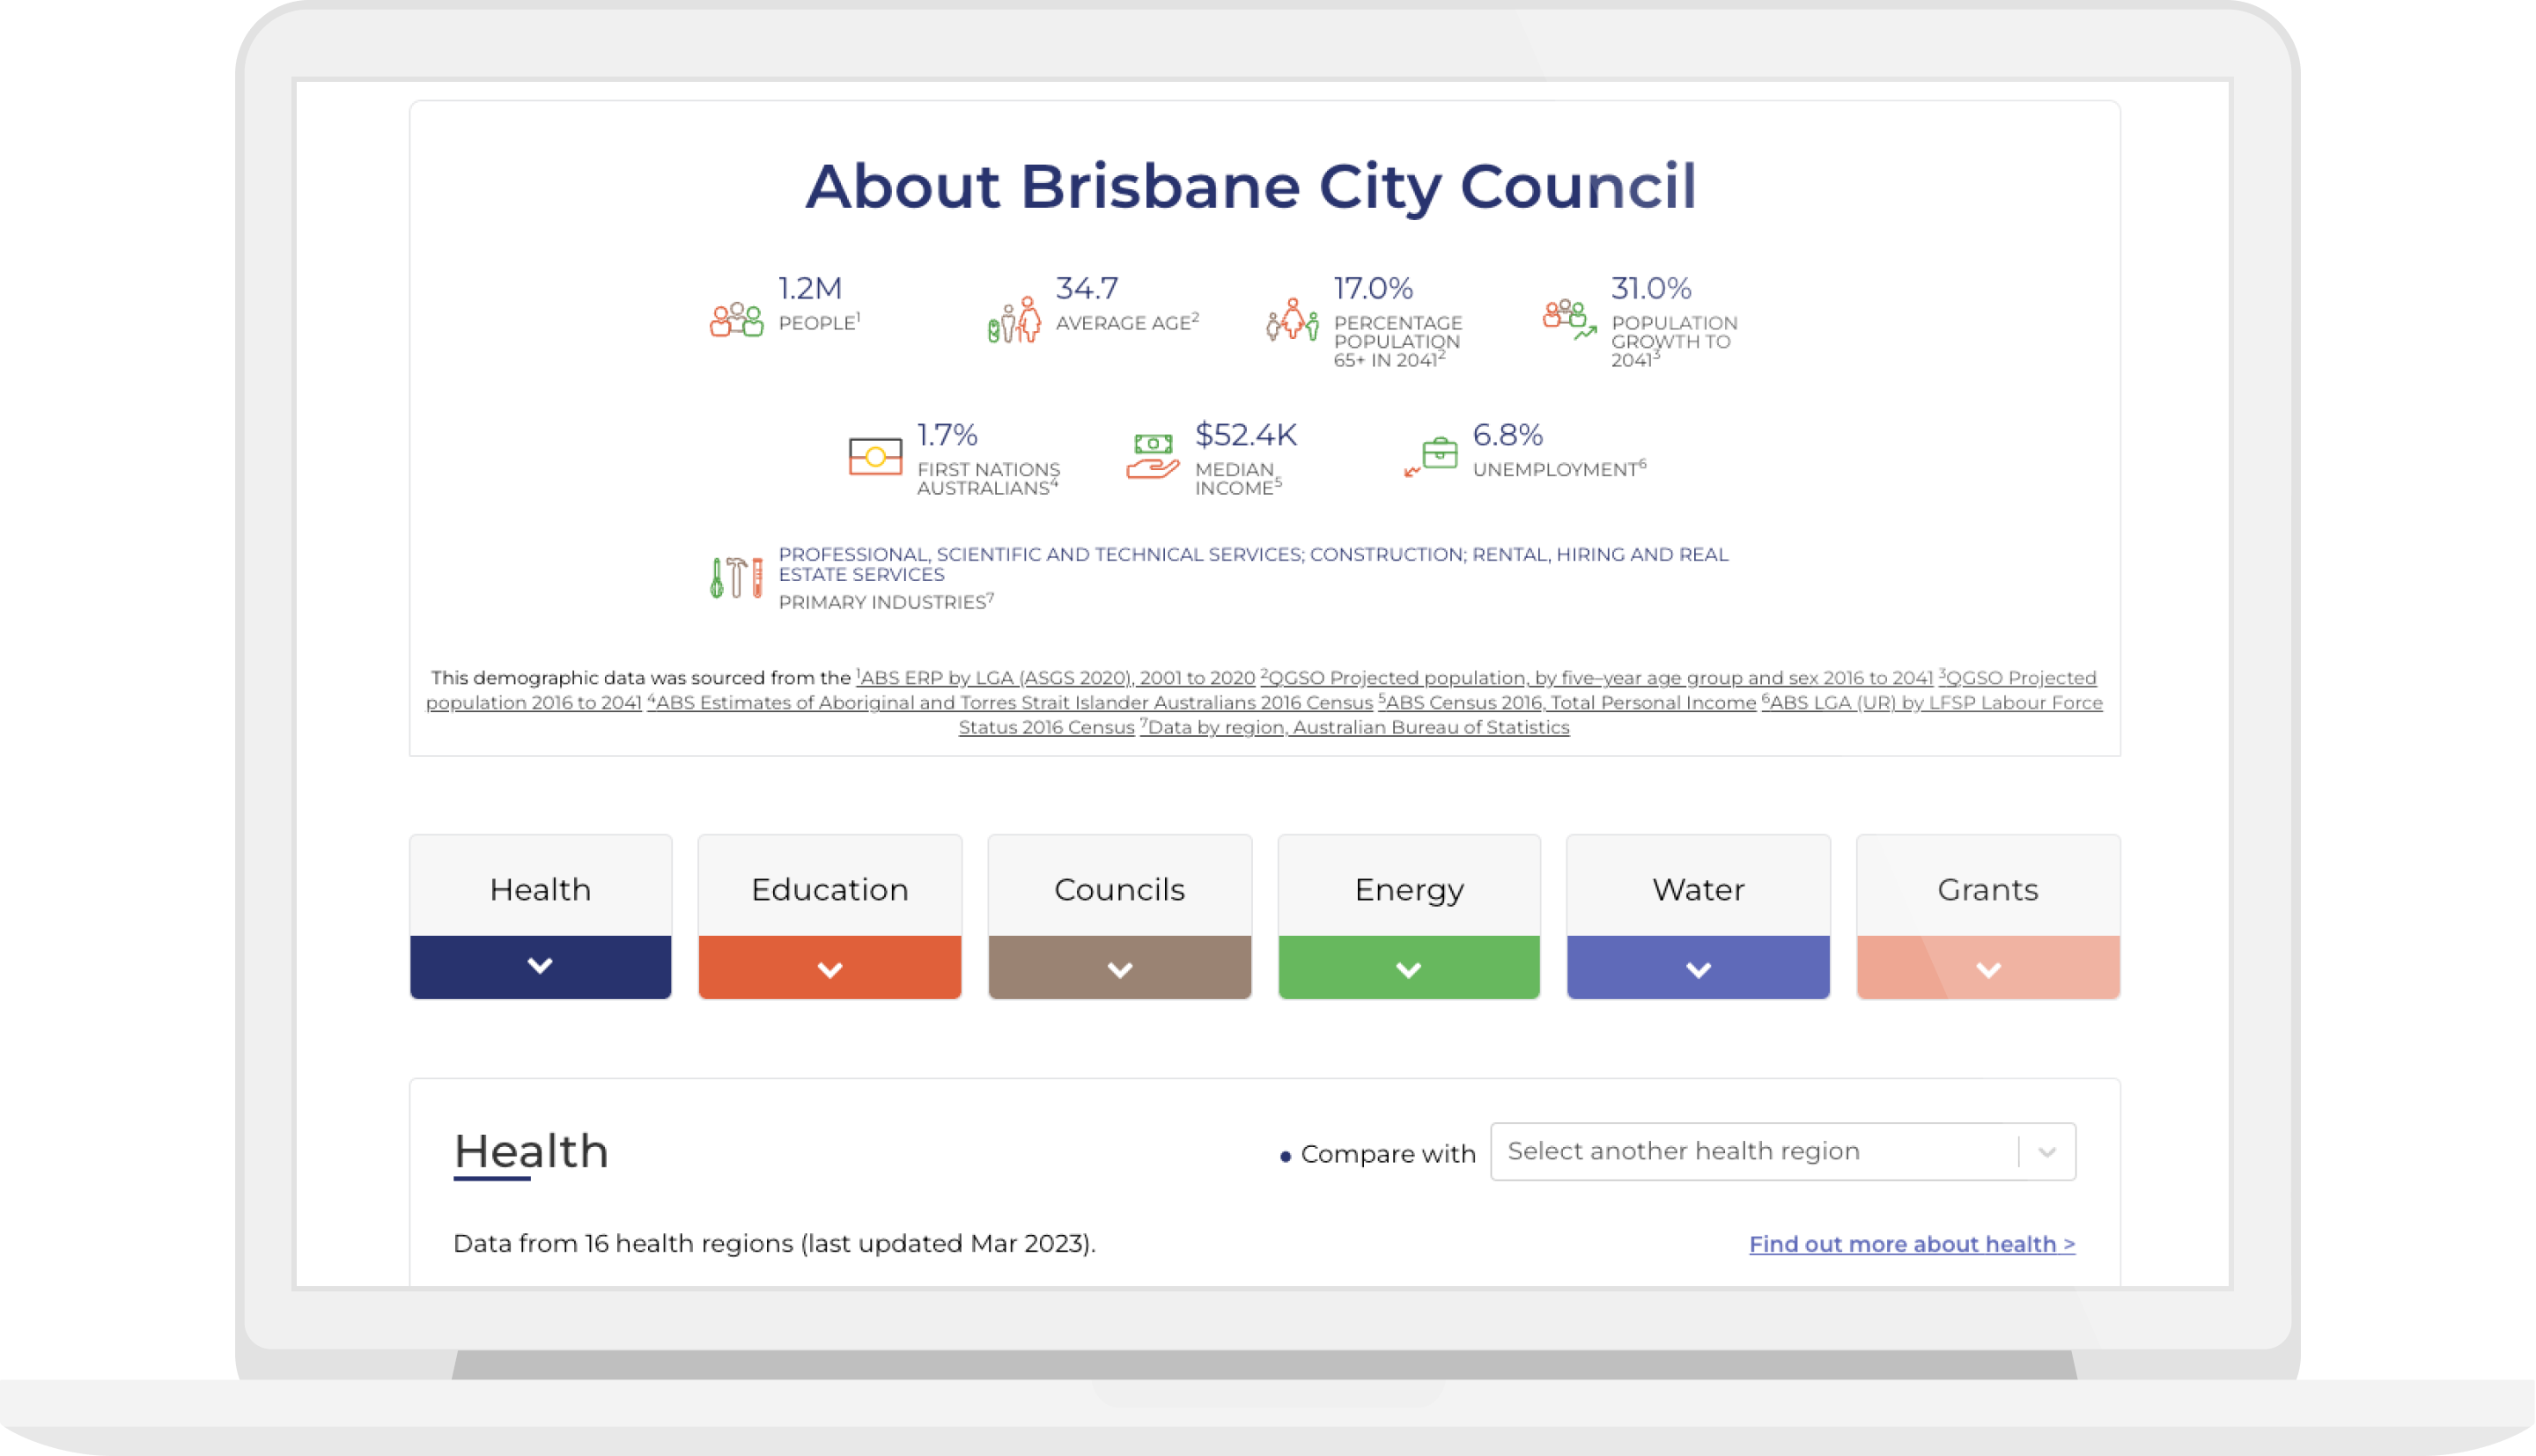
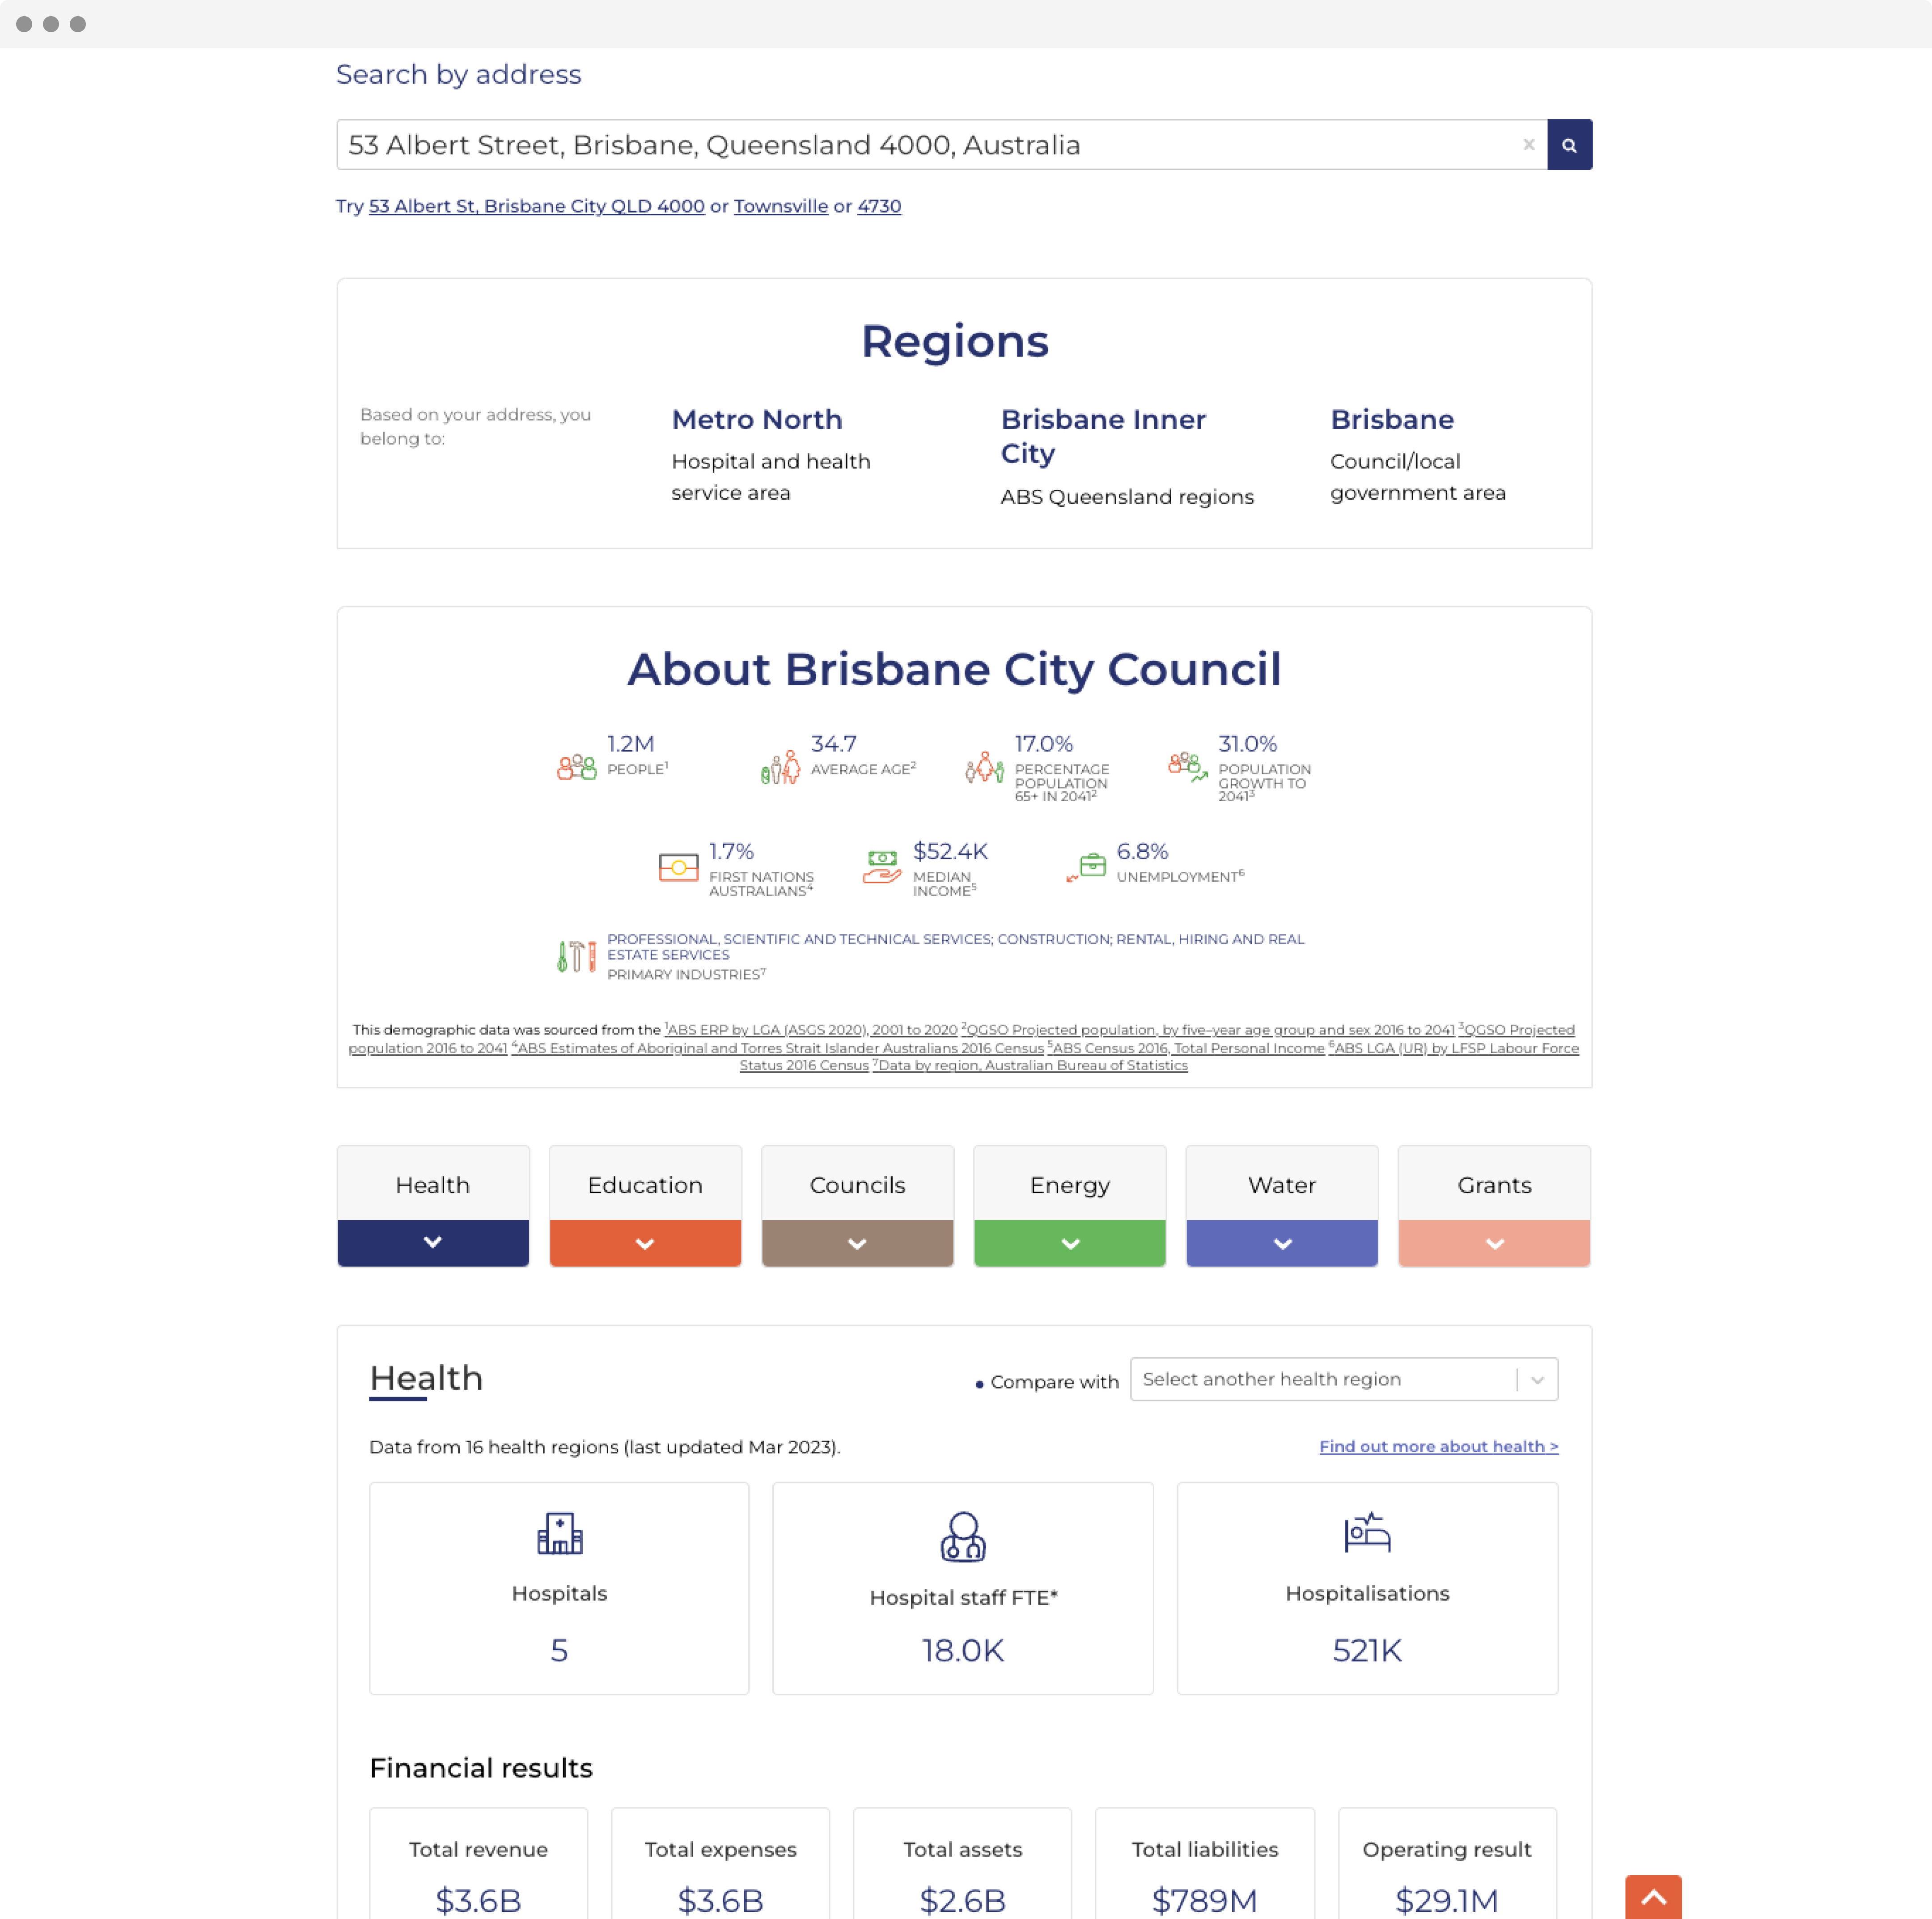
- Learn more about the region you live in and the public services you receive
- Explore your education entities
- Learn about your council
- Understand your hospital and health services
- Explore your energy entities
- Understanding your dams
- Discover your water entities
- Understanding sports grants
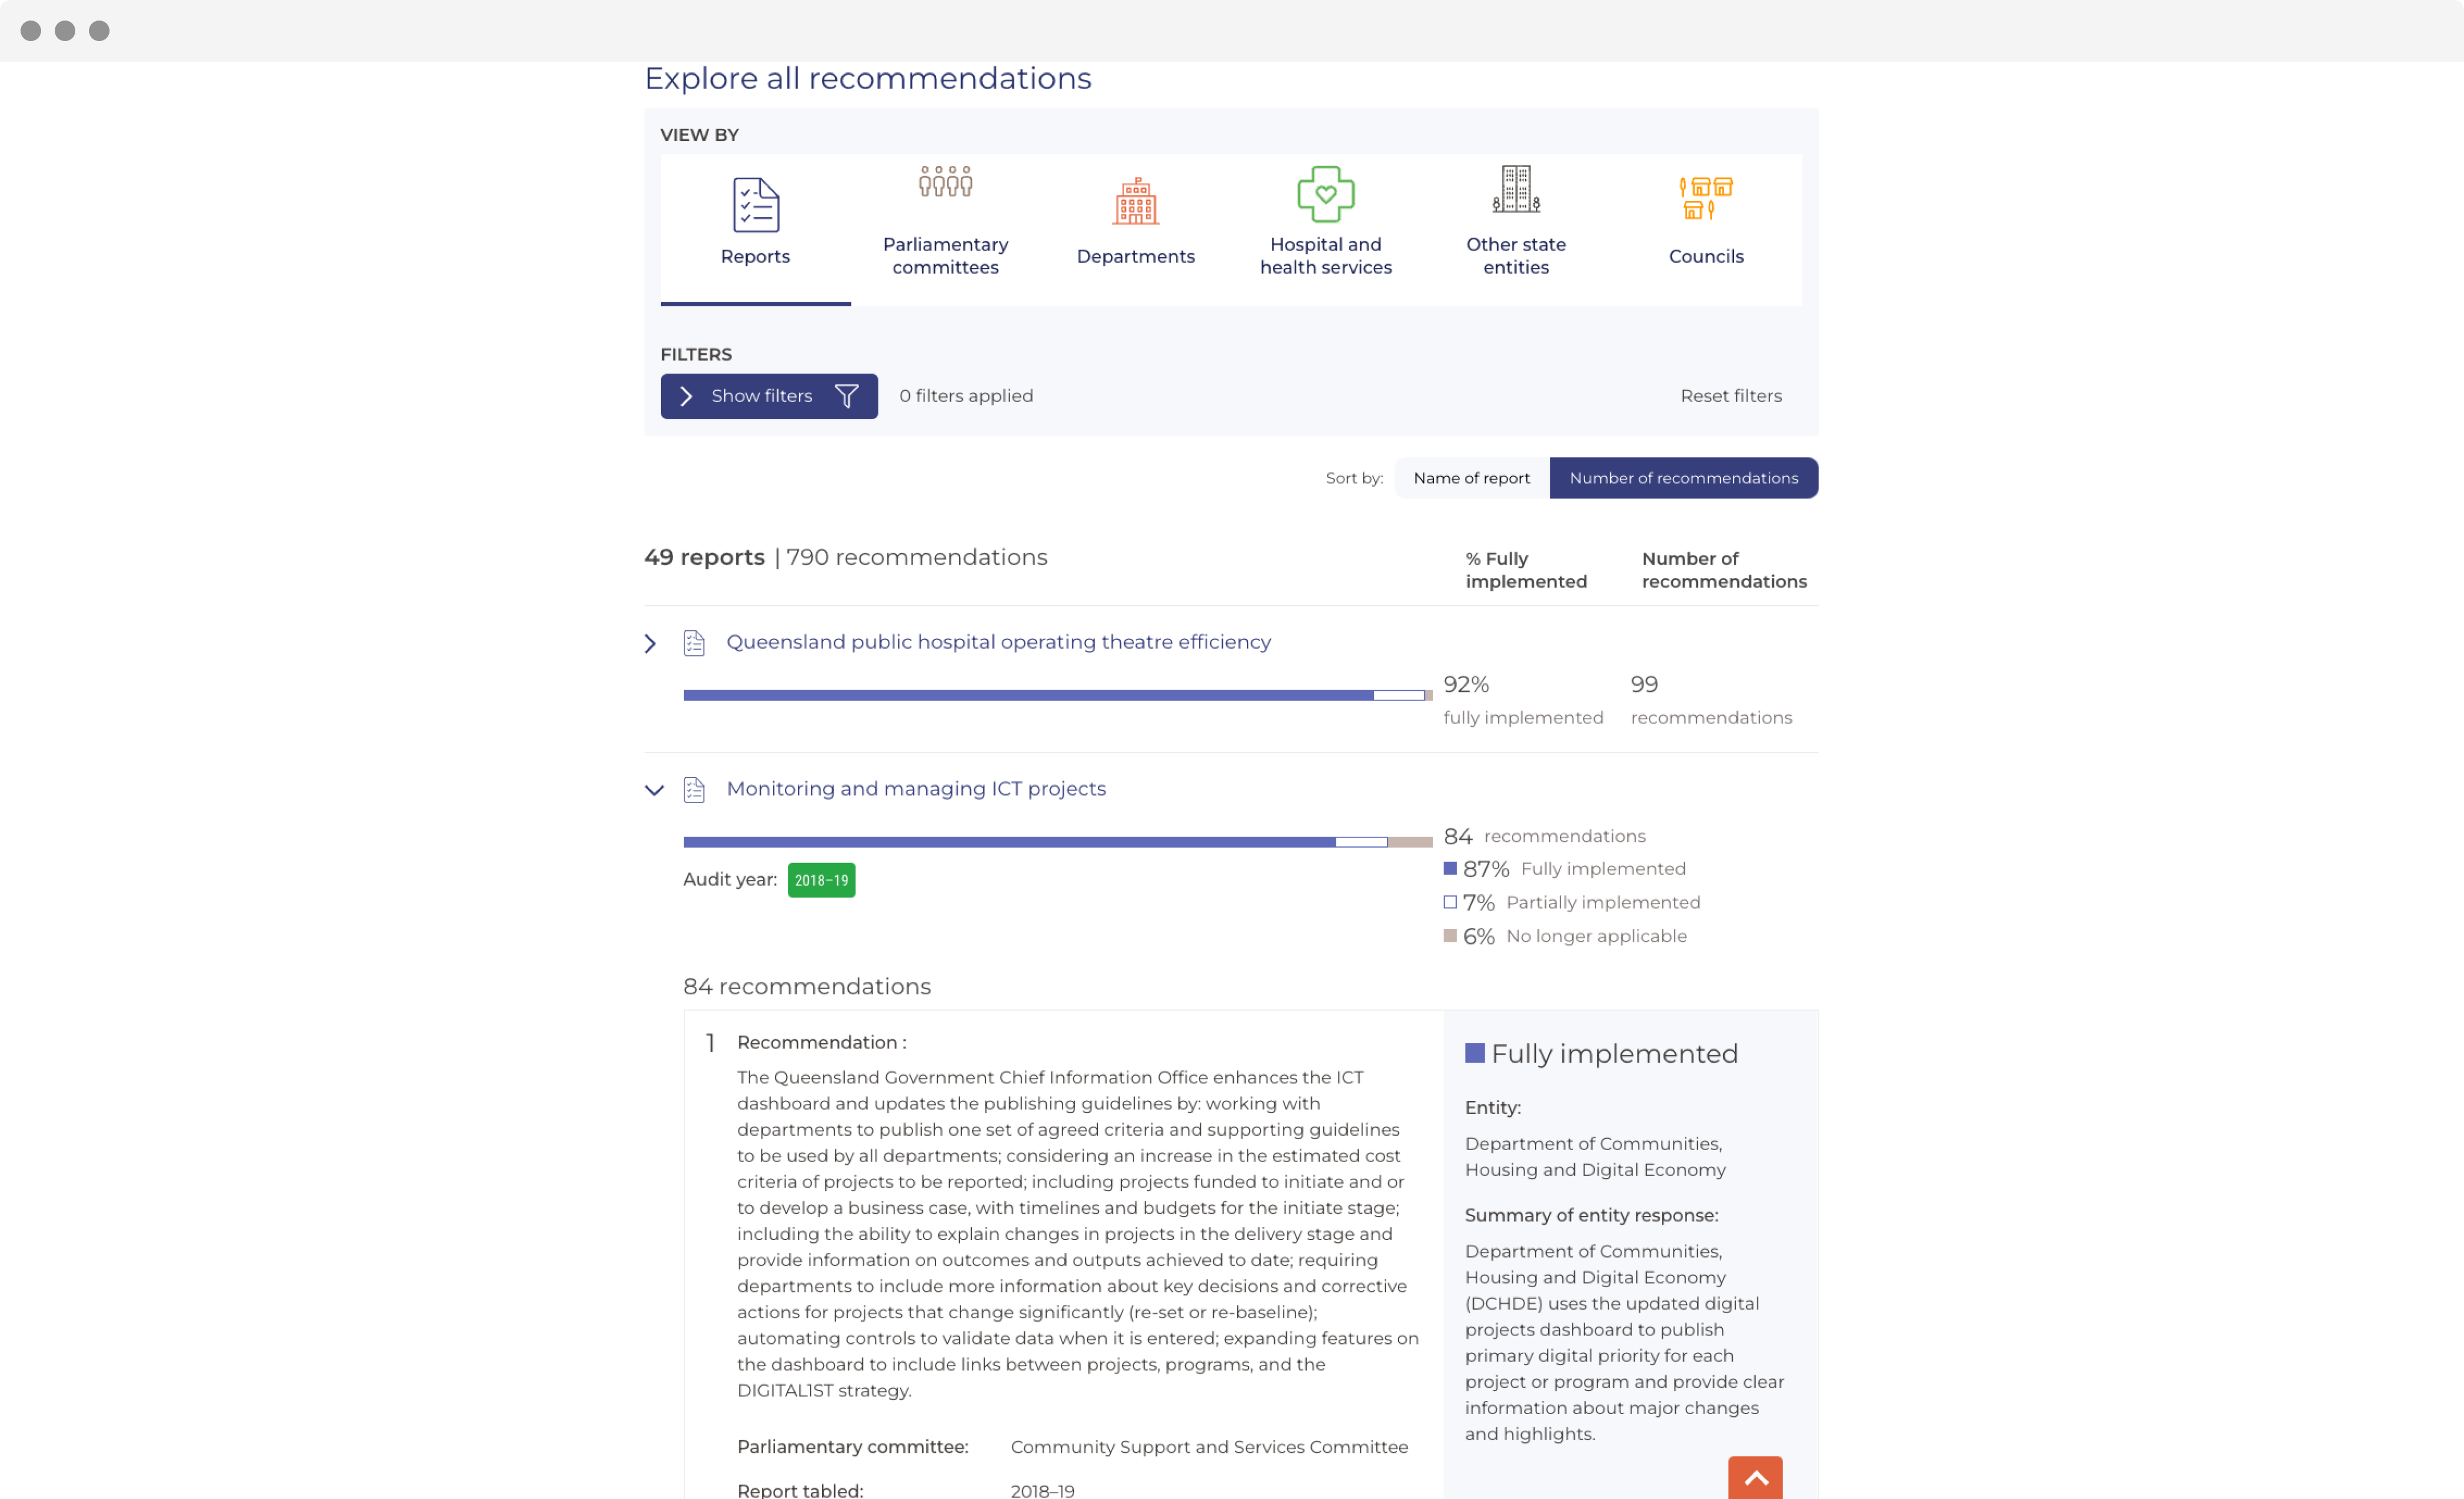
Status of Auditor-General's recommendations dashboard
QAO Queensland dashboard
Related projects and articles
-
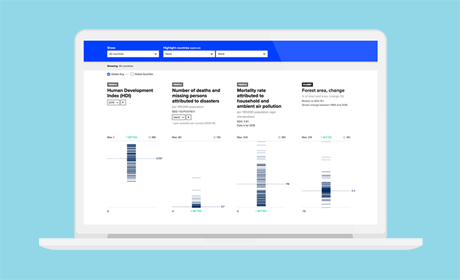
Interactive dashboard for the UN Development Programme’s 2020 HDR report
United Nations Development Programme
-
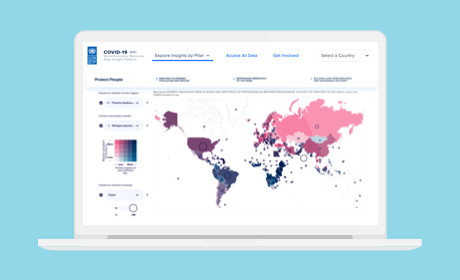
COVID-19 Socio-Economic Recovery Data Insight Platform
United Nations Development Programme
-
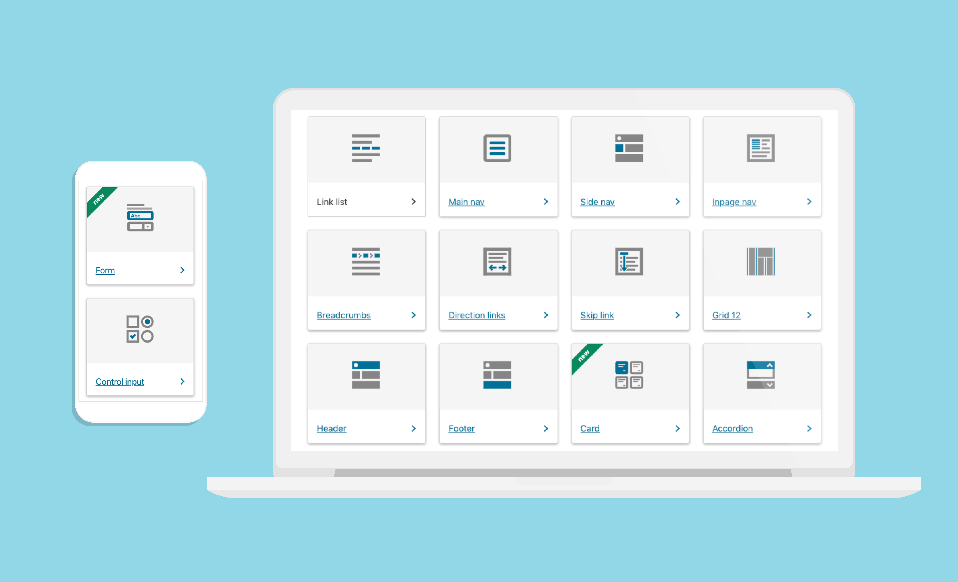
Data Visualisation in Government Design Systems
Article
-
Using dot density maps to visualise complex population data
Article