Creative Industries Insights Dashboard
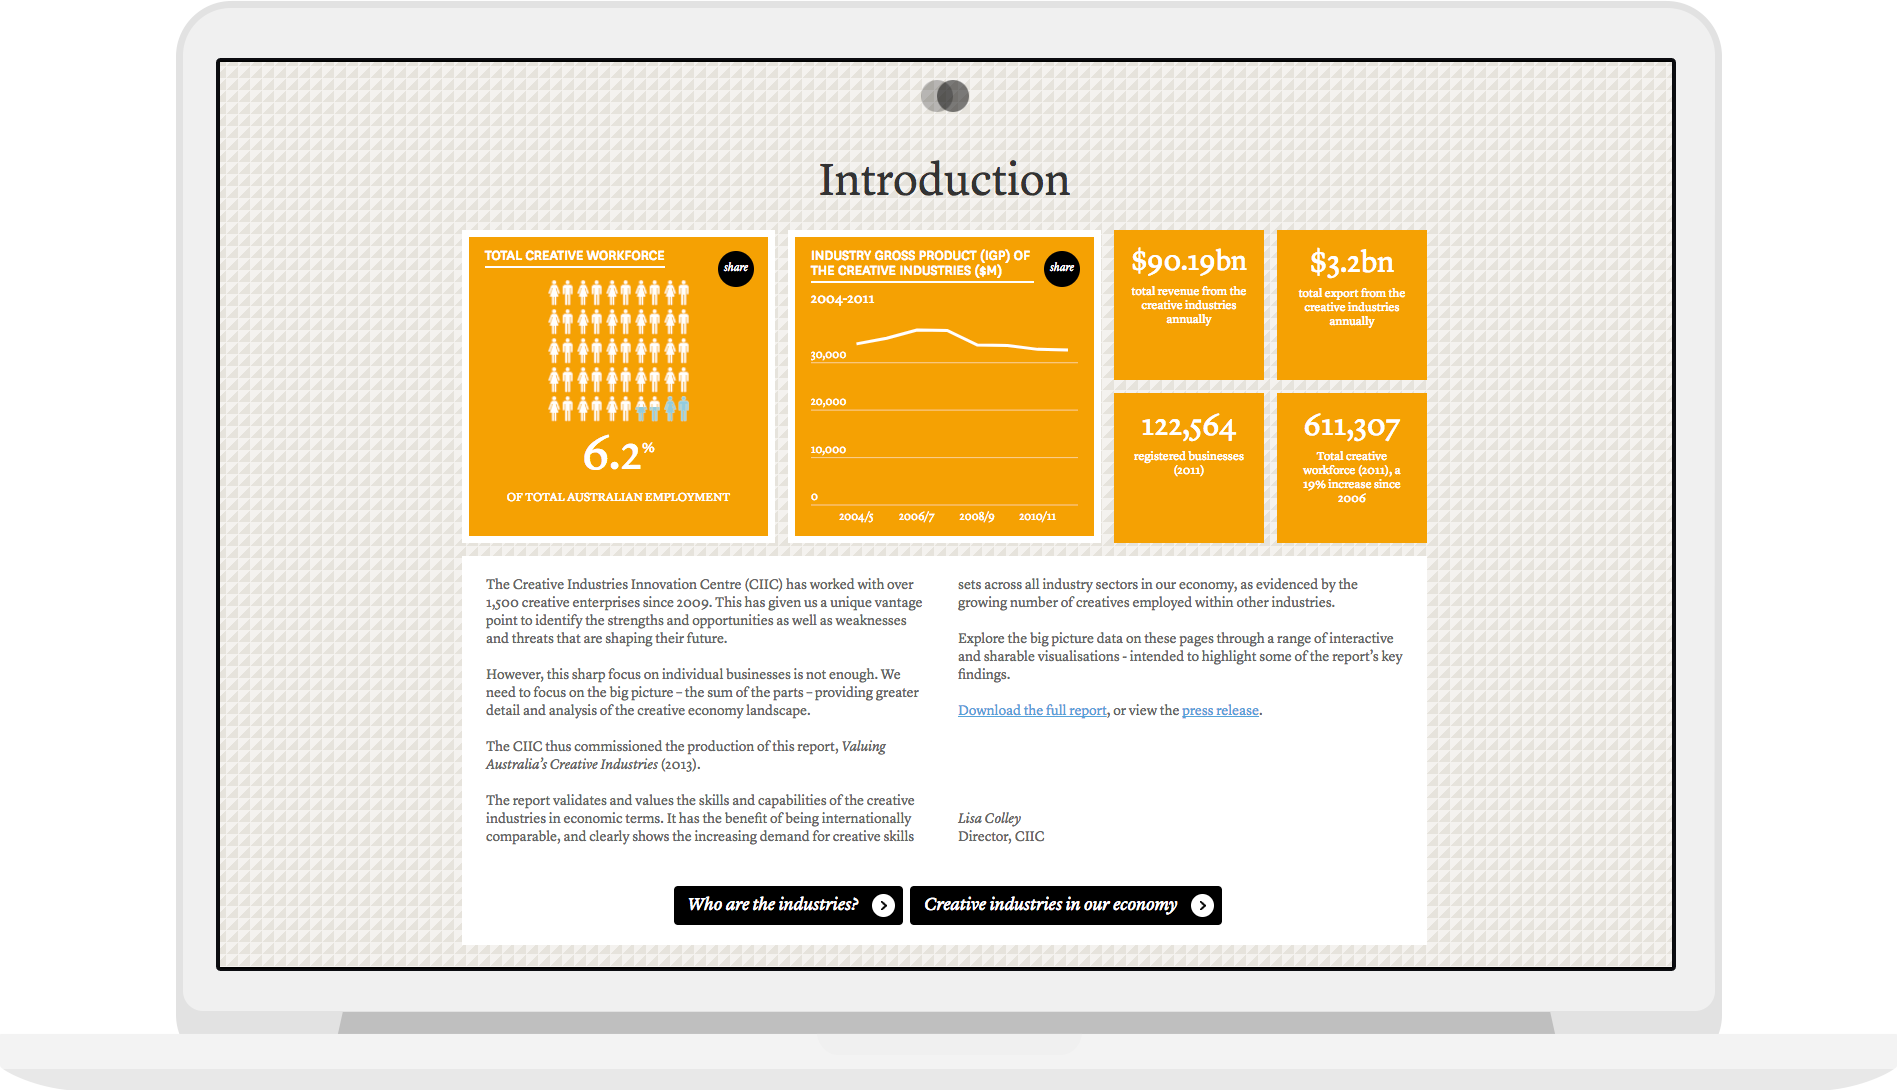
The challenge: show the real contribution of creatives
The Australian Government’s Creative Industries Innovation Centre (CIIC) ran from 2009 to 2014, providing one-on-one support to creative enterprises and facilitating research reports including Valuing Australia’s Creative Industries.
Small Multiples was tasked with visualising the Valuing Australia’s Creative Industries report, which aimed to show the real impact of creatives on the Australian economy.
Our solution: giving data context
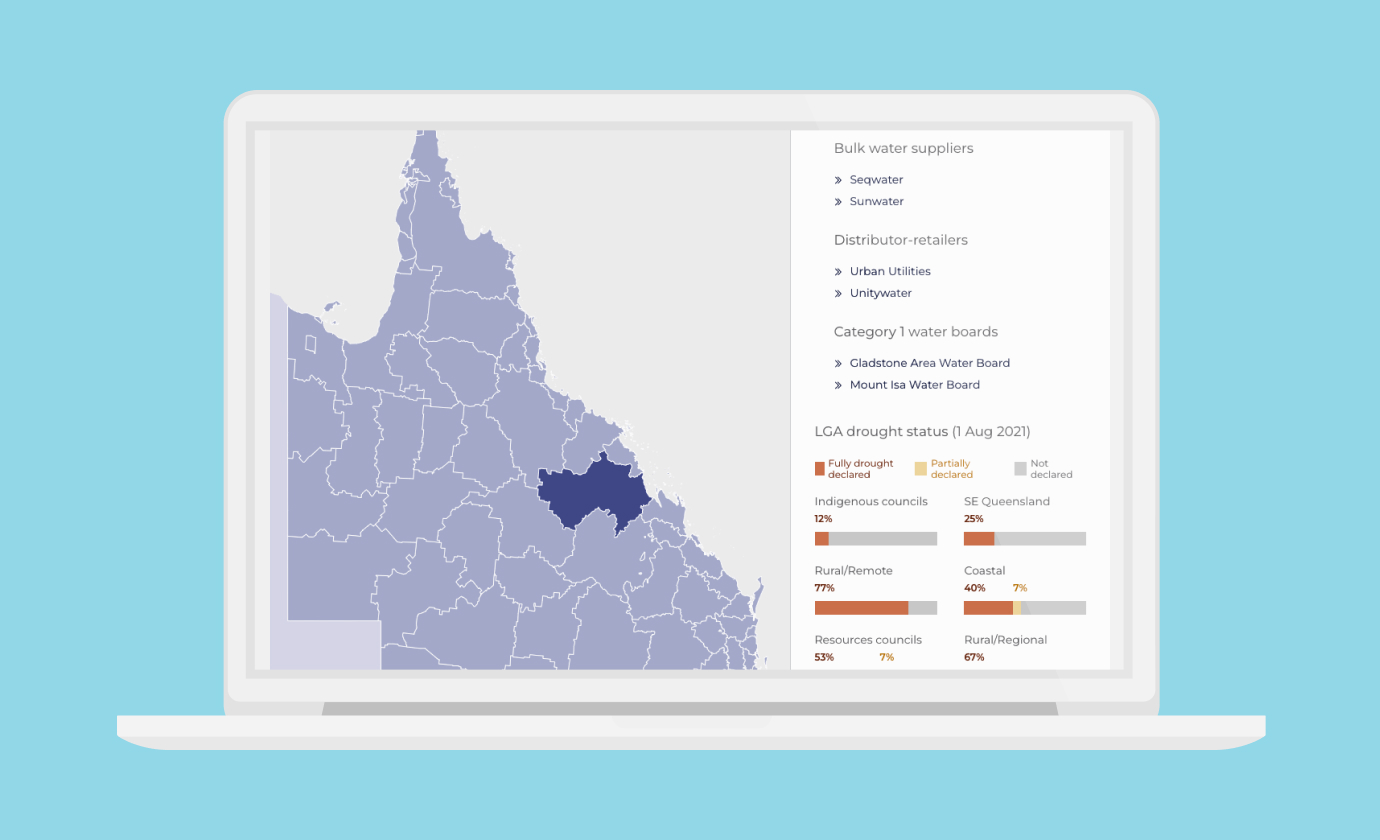
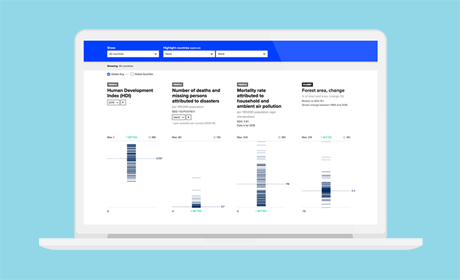
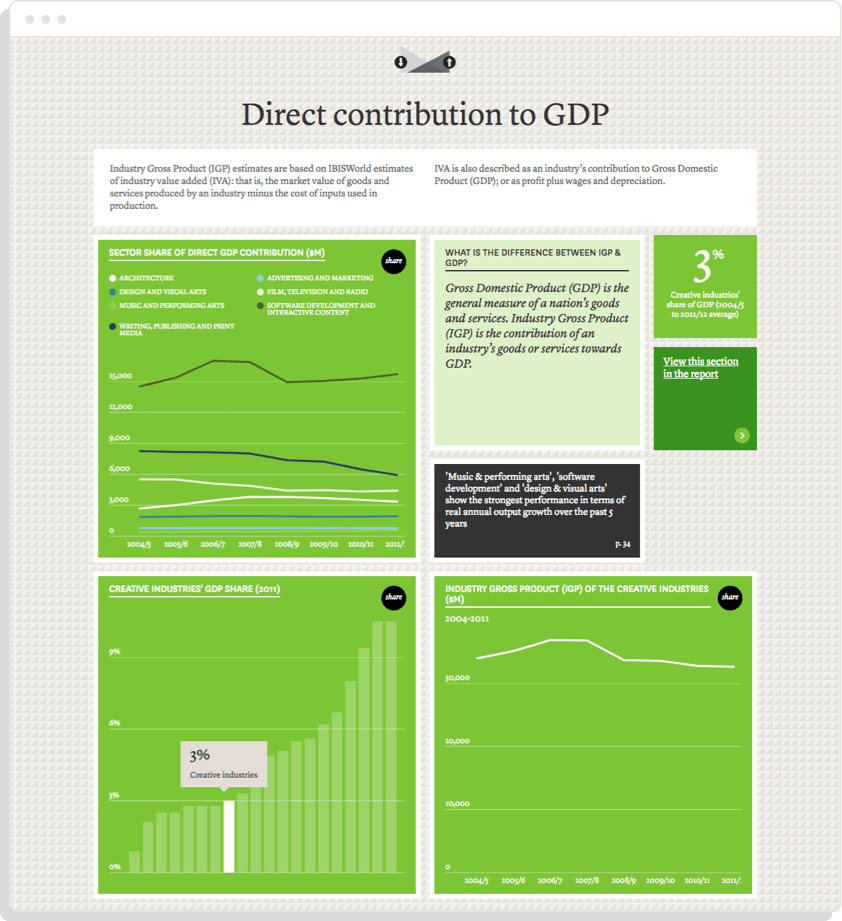
Our visualisation dashboard allows people to explore the employment, business and economic data on Australia’s creative industries by topic and sector breakdown.
A reoccurring theme in the report was to always display data within the vicinity of contextual information, as a way to help the audience putting abstract numbers in perspective.
Create once, publish many ways
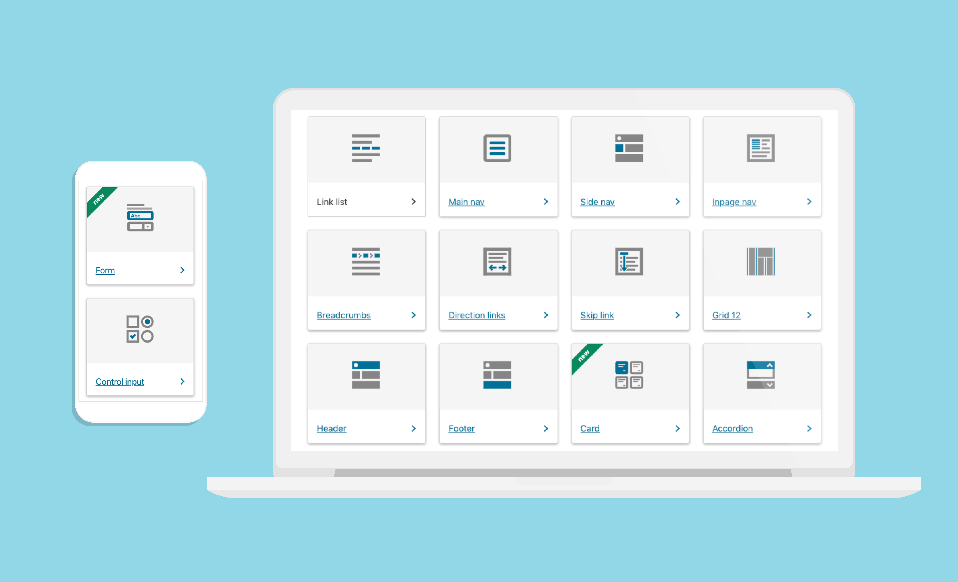
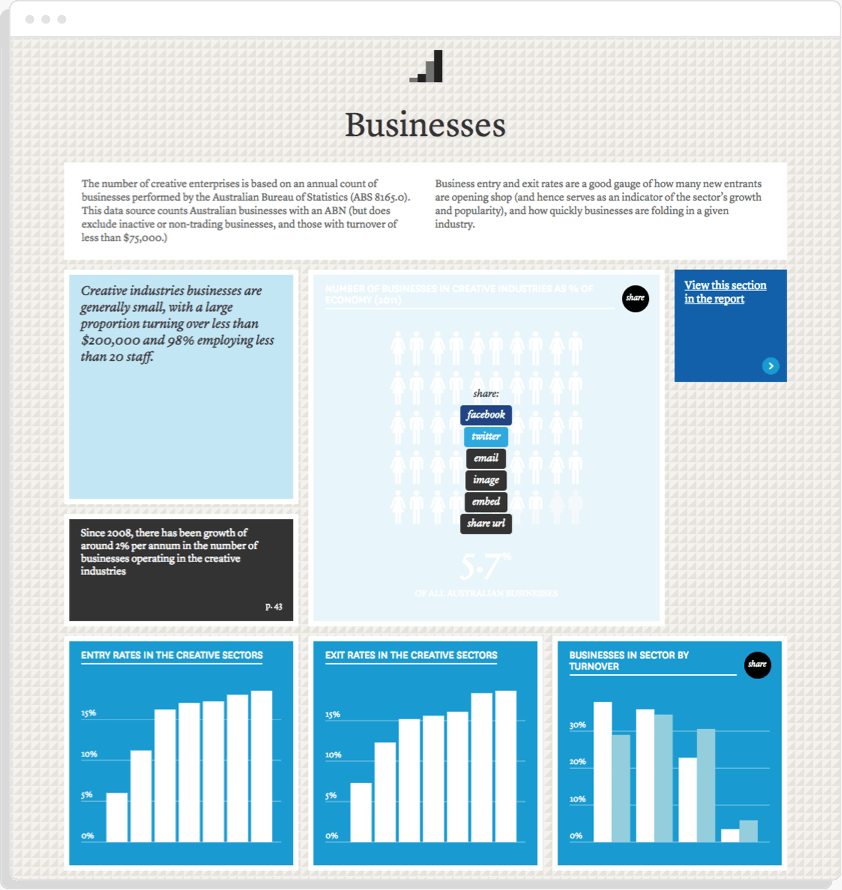
Everyone has a different requirement for information. Designed with versatility in mind, each chart in the report can be shared and published in a variety of ways.
Creativity and data needn’t be antithetical. In fact, we believe they go together. If you need to visualise something, or you’re a creative coder looking for work, why not get in touch?
 View All


