 View All
Building Sustainability Dashboard


The challenge: a single point of truth for Investa’s sustainability data
Investa, one of Australia’s largest commercial office real estate companies, has a vision to be a strategic partner for their tenants. This extends to making sure that their offices are energy efficient and sustainable.
But with the Investa Sustainability Report being released every year since 2003, it became clear that the company needed a single point of truth for their sustainability data, and one that could be updated continuously.

Our solution: a continuous reporting portal
Small Multiples developed a charting library and “single point of truth” process for data, in collaboration with Digital Garden. As we were interfacing with another system, the single point of truth database needed to be standalone, so we chose Google Fusion Tables.
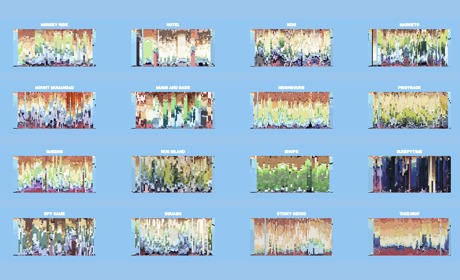
Each building in Investa’s portfolio now has a building scorecard with up-to-date data about emissions, gas, water, and electricity use, which are visualised alongside the NABERS ratings and other property information.
The charts have been built in such a way that allows the good people at Digital Garden (who have built Investa’s main website) to plug the charts into the CMS.
The report design and format was built on the wonderful 2010 report done last year by our friends at the IC and Toben.
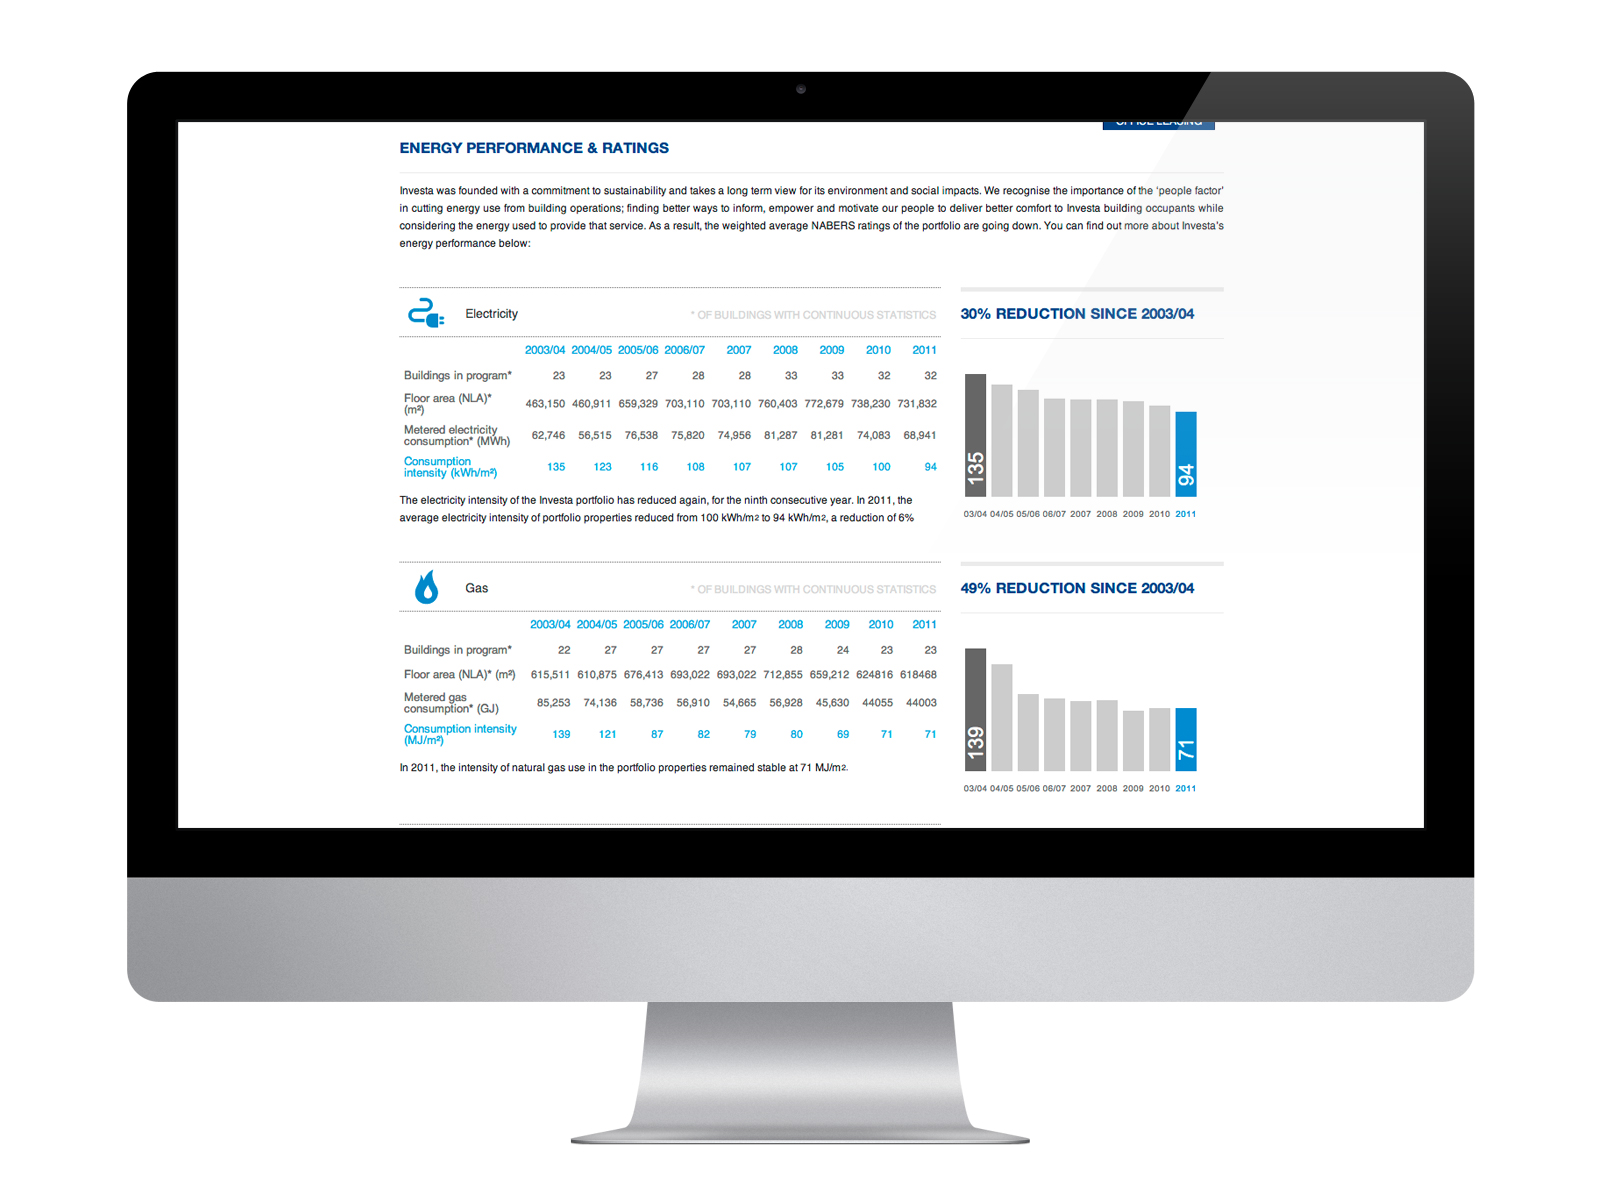
Energy Performance and Ratings: the latest stats
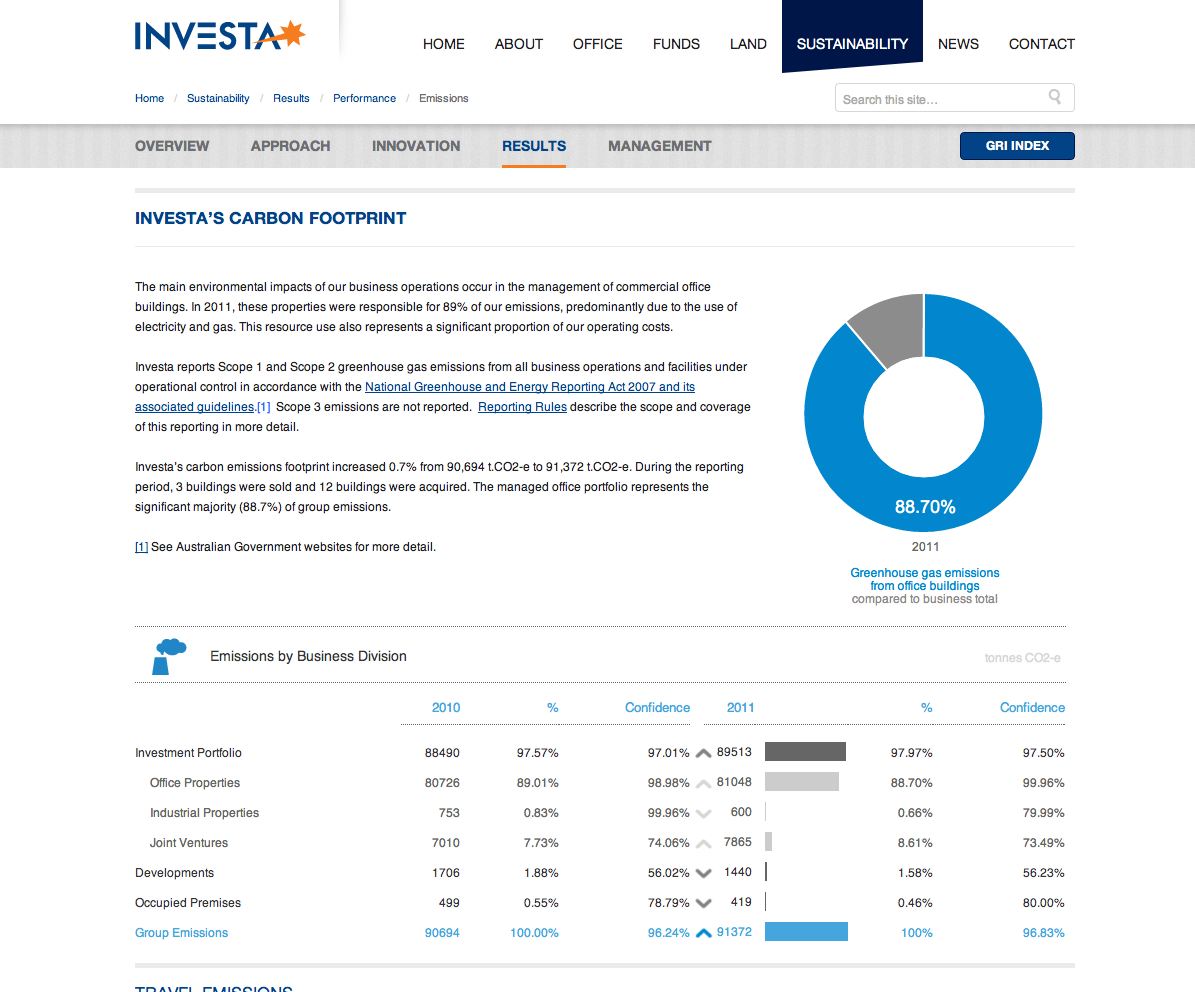
Investa’s Carbon footprint and emissions information
Building Scorecards
You can see other sustainability data work that we’ve done at Small Multiples in our projects with Westpac, the Sydney Green Grid and the NSW Environmental Data Portal.
Need a dashboard made? Want to work with us (or for us)? Get in contact.
Related projects and articles
-
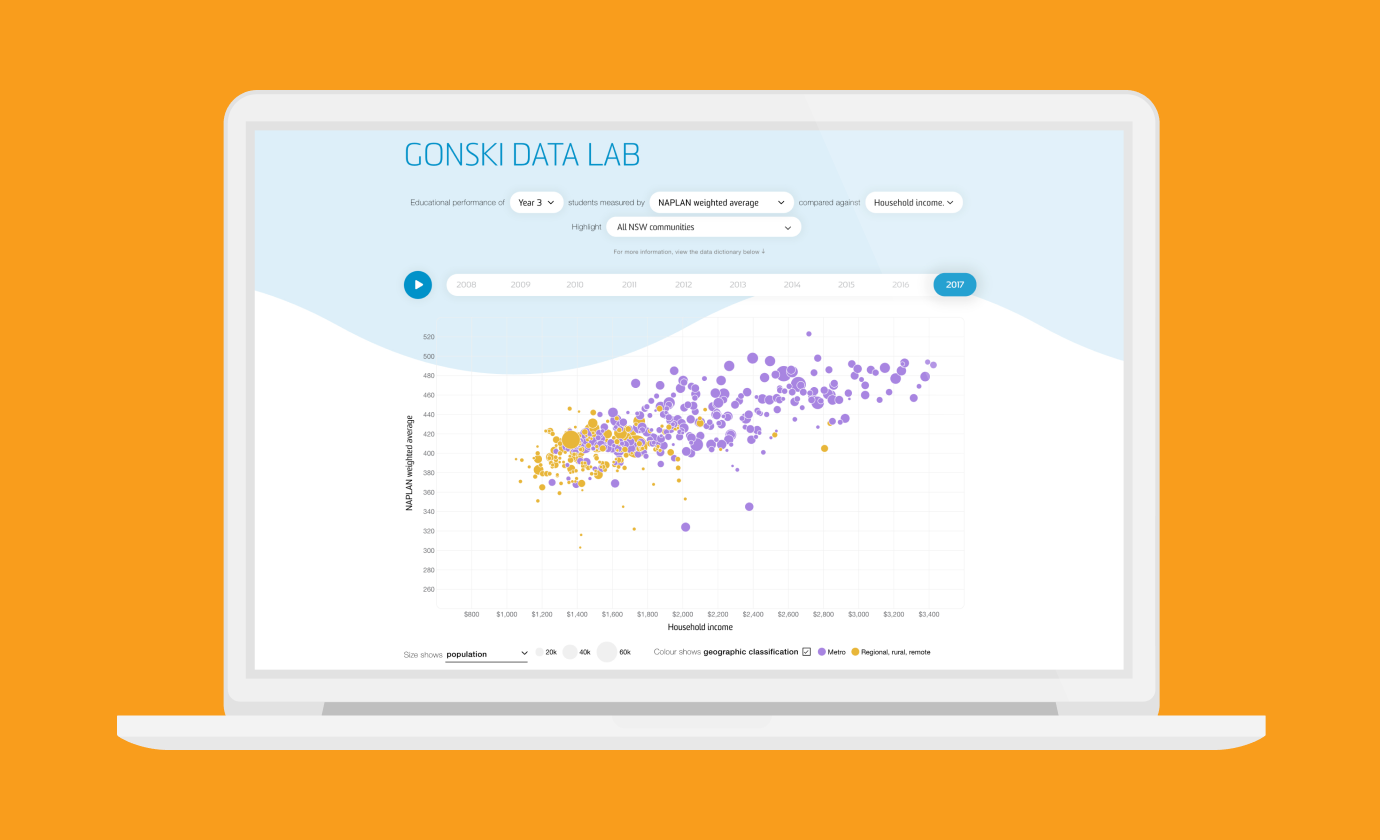
Revealing the social factors behind school performance
Gonski Institute for Education
-
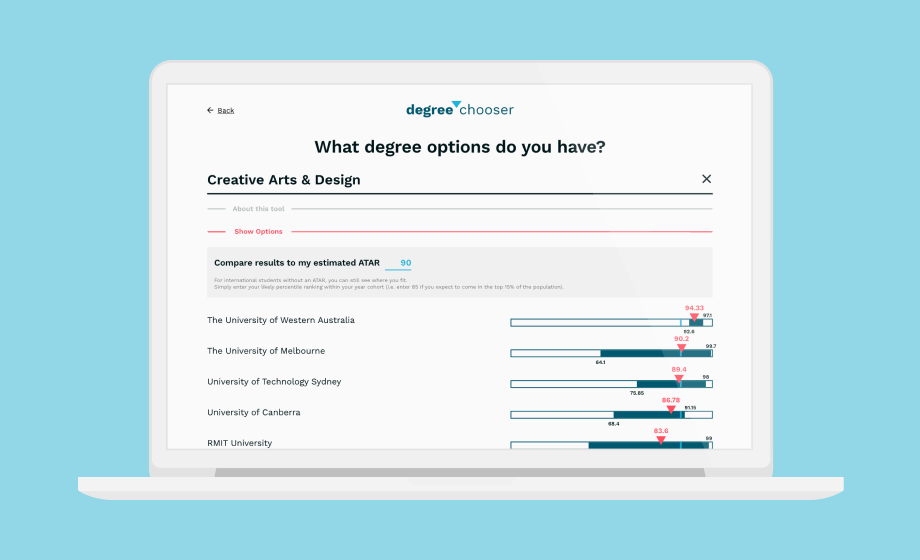
Degree Chooser
Barlow Advisory
-
This episode of Bluey is called colours
Article
-
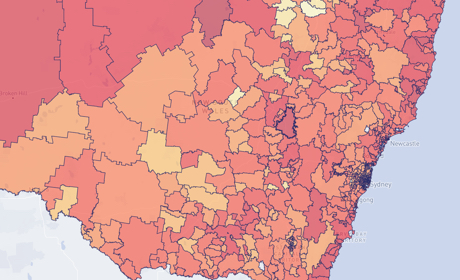
Occupational Risk due to COVID-19 in NSW
Article