 View All
Smarter advertising analytics


The brief
You’re about to spend a lot of money on a new advertising campaign. So you’re wondering: will people actually notice it?
That’s where Playground can help. Using eye tracking technology, they’re able to run controlled tests around where people are actually looking on web pages as they browse content. What types of ads get the most attention? What parts of your ad are people actually looking at?
Once you have the test data, you need to visualise it in a way that’s easy to understand and gain insights from. So we helped Playground build a full-featured analytics dashboard and CMS.
Our solution
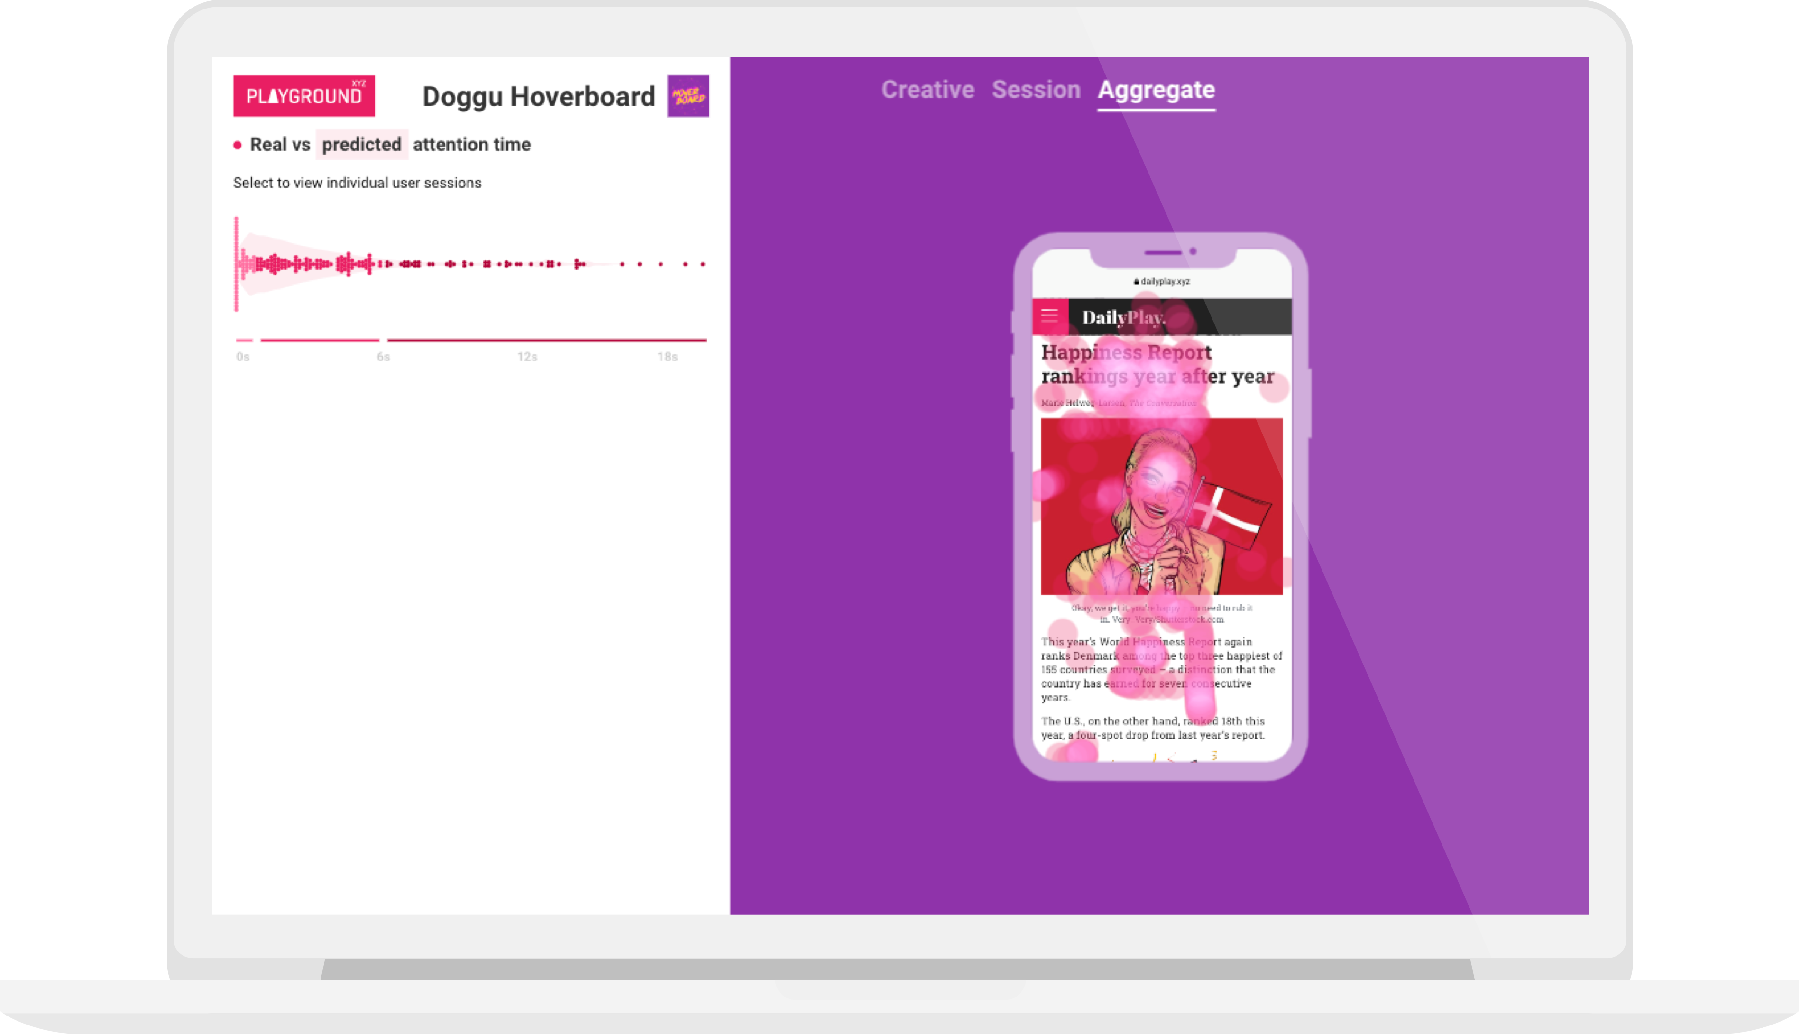
Companies and creative agencies can browse the viewing data from their testers via an intuitive custom dashboard. The “Real vs predicted attention time” graph in the top right shows where each individual tester fell on attention spectrum (did they spend 5 seconds looking at your ad? 10? Or zero?). This is then compared this to Playground’s AI prediction of the attention spread (the pink area). In this way, you can see if your ad is performing above or below average.
Each individual session can be played in real time, with the user’s attention visible on the screen display on the right.
The ‘aggregate’ tab shows where most people are looking as they scroll through a piece of content. This way you see which parts of your ad people are actually looking at.
We also built a full CMS to allow uploading of tester data and managing different campaigns:
We built this technology using React, Node.js, BigQuery and Google Cloud Storage. Do you have an innovative project that you want to get off the ground, using the latest tech? Get in touch.
Or if you are looking for a way to measure and improve the impact of your advertisements, get in touch with the great team over at Playground.
Related projects and articles
-
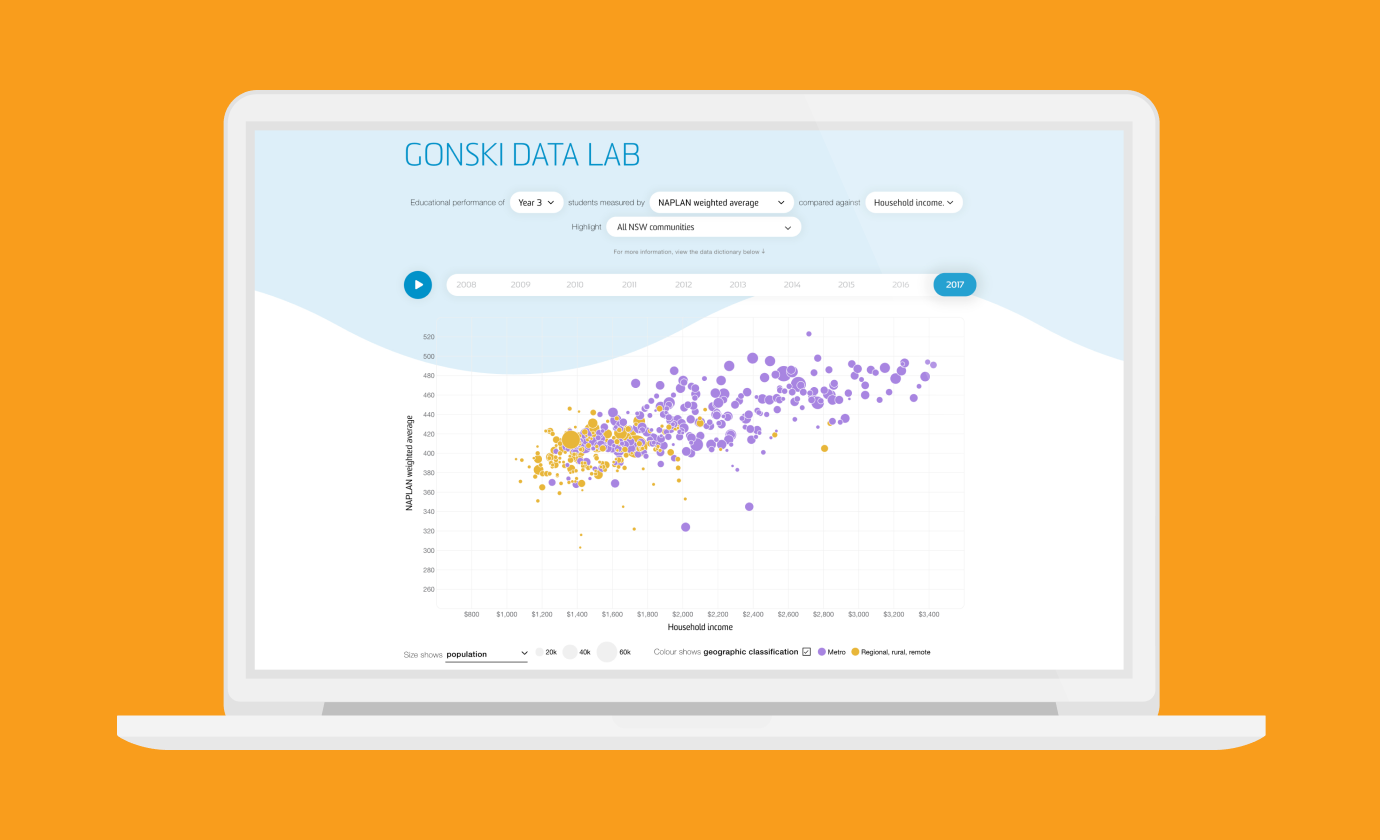
Revealing the social factors behind school performance
Gonski Institute for Education
-

Degree Chooser
Barlow Advisory
-
Introducing the new Small Multiples website
Article