Where immigrants choose to live is important; it's a lively reflection of the past, present and future of Australian cities. Should we settle for simple assumptions about why certain immigrant groups congregate in certain parts of the city? While confirmation of our prejudices provides quick gratification, we hope these maps serve as a starting point for uncovering more unique and nuanced stories with data.
How to visualise the growth of immigrant groups
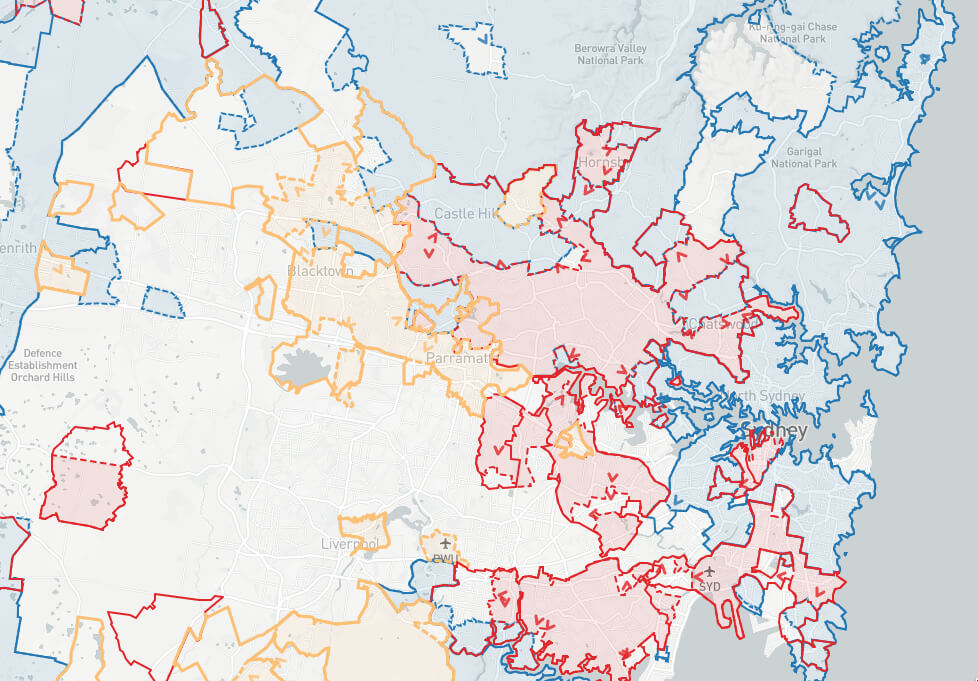
In these maps, we are visualising growth as movement. Each arrow represents a direction in which the immigrant group grew from its nearest base to a newly acquired area. A base is one or more suburbs that had this group as the top country of birth in 2011, and the newly acquired area is a suburb that this group topped in 2016. The movement of arrows provides a sense of the overall dynamic nature between the groups.
- >Oceania and Antarctica
- >North-West Europe
- >Southern and Eastern Europe
- >North Africa and the Middle East
- >South-East Asia
- >North-East Asia
- >Southern and Central Asia
- >Americas
- >Sub-Saharan Africa
England, China and India
England is still undisputedly the largest immigrant groups. People born in China and India, the two most populous countries in the world, are starting to dominate in metropolitan areas where England reigned. Maps below show what used to be the 'boundaries' of these three large groups in 2011, what the boundaries look like now, and the ways they have been redrawn.
Sydney
2011 top country (overseas) of birth is
- China
- India
- England
2016 top country (overseas) of birth is
- China
- India
- England
The direction the immigrant group expanded
- > China
- > India
- > England
Melbourne
2011 top country (overseas) of birth is
- China
- India
- England
2016 top country (overseas) of birth is
- China
- India
- England
The direction the immigrant group expanded
- > China
- > India
- > England
 View All


