View All


Visualising complex spatial data is something that has previously been the domain of computer graphics studios, however, WebGL has slowly, but steadily been more widely adopted, and has reached a level of maturity and stability across a huge range of browsers and devices. This technology allows greater control and direct access to hardware accelerated graphics, meaning we gain the ability to work with datasets on the web that the traditional DOM model or canvas could not handle.
The principle way that WebGL achieves this goal is by moving processing to the graphics hardware, which is much more suited to parallel operations that large data visualisations require. Additionally, with such close control of the hardware, it is trivial to transition into three dimensional visualisations. Ordinarily this level of programming is an extremely specialised and a difficult task, however, libraries have popped up to simplify the process, including three.js and deck.gl.
When developing a new spatial visualisation, we have to determine whether the visualisation would best communicate its insights by being interactive, an animated interactive, a static visualisation or an animation. It is important to analyse the data and develop an understanding of the information and insights it provides before making these decisions.
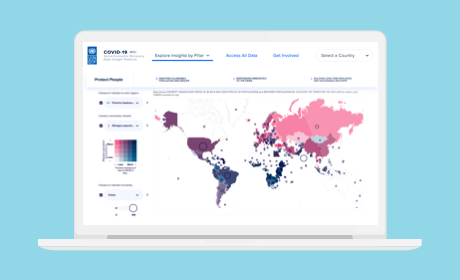
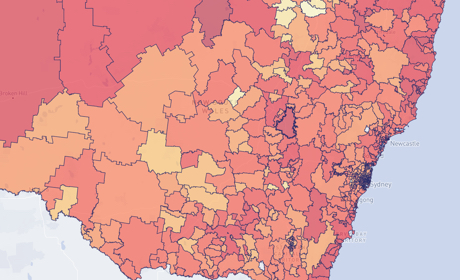
Our interactive map visualisations utilise deck.gl and Mapbox, which helps us to get up and running, visualising data in a 3D space quickly. Mapbox provides a huge set of geographic imagery, ranging from styled vector maps to high-resolution satellite imagery.
Some visualisations, particularly temporal data or data depicting movement, benefit heavily from animation. We have built a number of custom layers on top of deck.gl to facilitate these challenges.
Visualising public transport trips in Sydney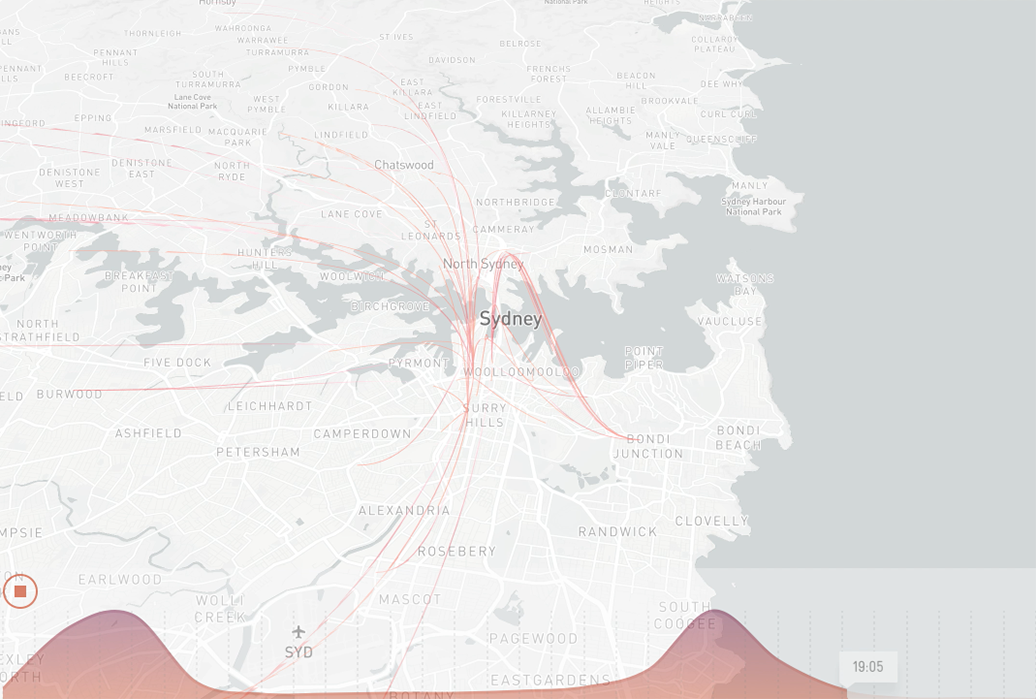
However, this approach has its limits. As all of this processing is done on the end user’s device, we have to ensure we don’t exceed a certain bandwidth or processing budget, otherwise we risk creating an unresponsive visualisation. For more complicated datasets, or for projects that demand more visually impressive effects, we utilise the ability of modern browsers to stream video with high quality and compression to deliver a better experience for the user.
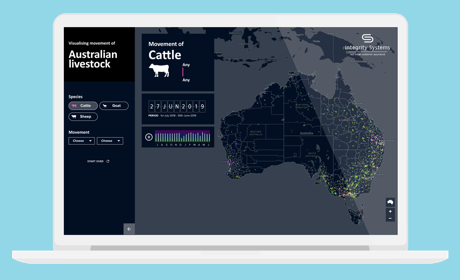
Generating these visuals is another challenge. We’ve come up with two different approaches. The first is to utilise the same web-based technologies, which we’ve integrated into an automated video generation system. This allows us to use the visualisations developed for web, but with more complicated datasets. Additionally, it’s scriptability allows us to generate a unique visualisation for hundreds of datasets. Below is a screenshot of the tool rendering one animation, and below that is the final video.
The tool used to generate animations, using Mapbox and Deck.gl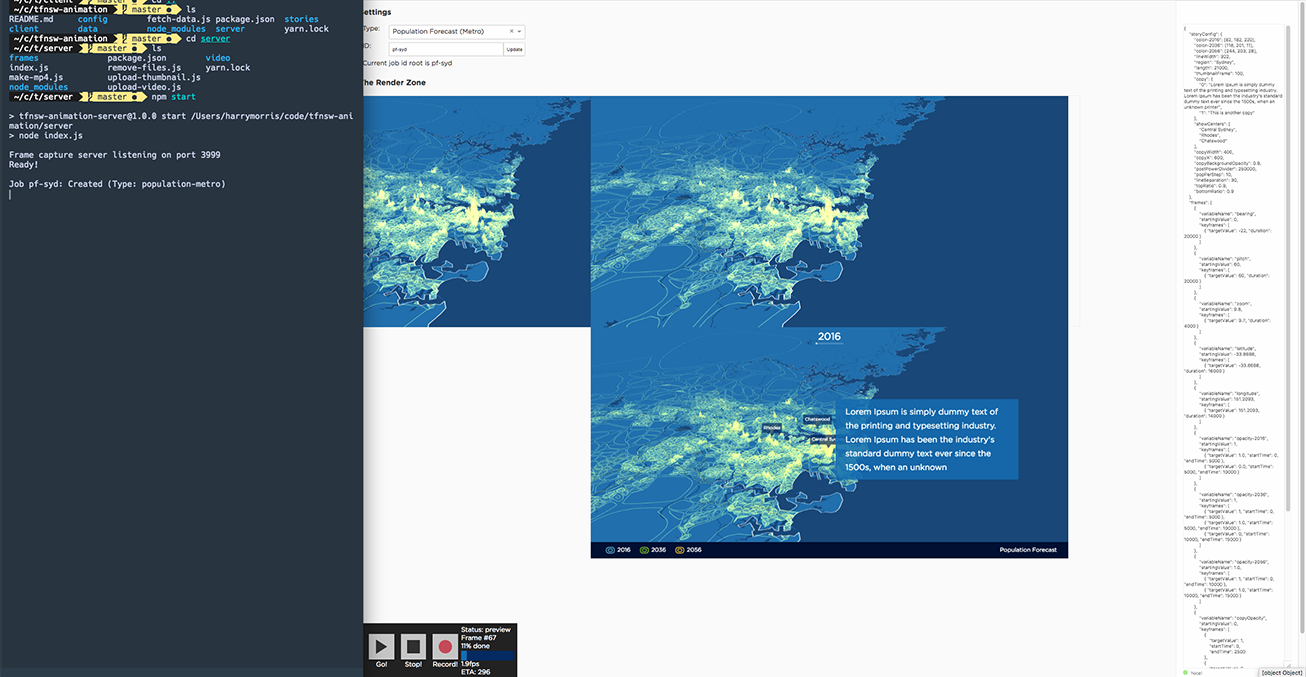
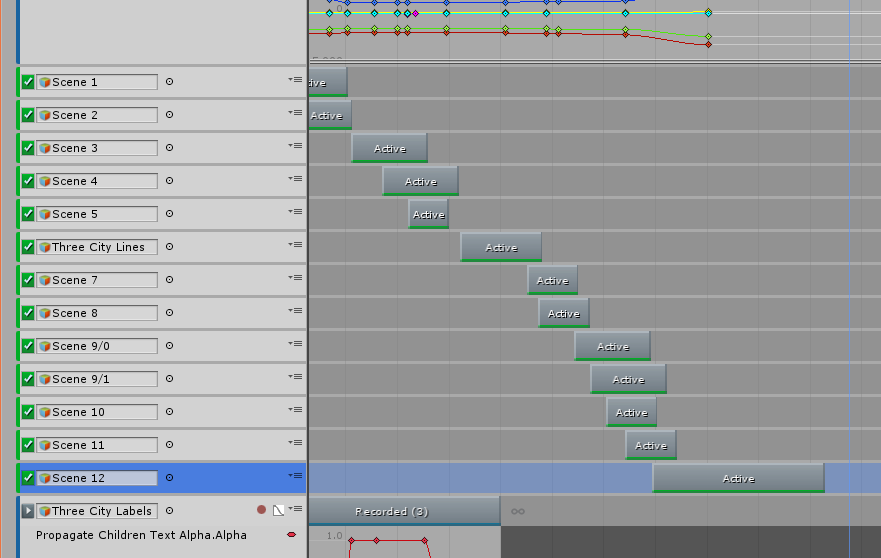
Our newest approach is based on the popular Unity game engine, which provides us with tools to easily and quickly put together high quality and high performance graphics.
Mapbox have very helpfully provided a unity library to import Mapbox satellite and elevation data into Unity, which we have extended to better suit our data visualisation goals. Unity provides a toolkit for creating immersive visual experiences, typically used for games. New features being added to Unity are making it more and more useful as a filmmaking tool, including a powerful timeline feature, procedural cameras and a cinema-grade post-processing stack. We’ve put together data processing utilities and tools to bring data into Unity’s 3D world, all of which allow us to intricately choreograph a pace and mood to best communicate key insights.
We are able to orchestrate hundreds of thousands of data points down to the frame.
The sky (or space) is the limit with Unity. See the 3D animation we created for Transport for NSW below. Digitally mapping this to a sphere with accurate elevation data helped in setting the global scene for the story.